Operations Management Suite 101: Log Analytics Queries 101
This post is intended to get you started with querying data that is stored within your Operations Management Suite (OMS) / Azure Log Analytics Workspace. The first section has some basics tips. The body of this post is a long list of example queries, together with explanation for the syntax and example results. Finally, there is a list of some of the tables you may wish to query inside OMS / Azure Log Analytics to retrieve certain data, and the OMS solution that collects and ingests data into the particular table.
NOTE: Any comments and feedback greatly appreciated if you found this post helpful or have any corrections / suggestions. Cheers, Antoni
General Getting Started Tips
TIP 1: Operators / functions (in the query language command) like search, summarize, count(), bin() etc ARE case-sensitive so Summarize, Count(), Search, Bin will not work!
TIP 2: Shift + Enter is your friend, as it is a keyboard shortcut that will run the query
TIP 3: The Analytics / Advanced Analytics portal can be used to compile more advanced queries- access by clicking either the 'Analytics' or the 'Advanced Analytics' buttons in the log search page.
TIP 4: SecurityEvents are stored in the SecurityEvents table. Collection is enabled by enabling and configuring the Security and Audit solution
Other Events from other Windows Event logs are stored in the Events table (collection is enabled via the Advanced Settings>Data>Events. See here for more on adding Windows Event data Sources
TIP 5: In addition to the rest of this blog, check out these links to help get started:
- List of OMS Solutions including Overview (Licensing / Communication Notes) - Add Solutions
- Query Best Practices - Log Analytics Query Best Practices
- Playgrounds' which have lots of demo data to go out and try your queries out on: Log Analytics Demo and Playground And Application Insights Demo and Playground
- More language refence here: https://docs.loganalytics.io/docs/Language-Reference
- Getting Started with Queries: https://docs-analytics-eus.azurewebsites.net/learn/tutorials/getting_started_with_queries.html
- SQL to Log analytics cheat sheet: https://docs-analytics-eus.azurewebsites.net/learn/cheatsheets/sql_to_azure_log_analytics.html
- Useful Operations Management Suite / Azure Log Analytics Links and Resources page: https://aka.ms/omslinks
| Query | Explanatory and reference Notes | Example Results | |
| 1) | search * | searchAll Collected data (will return total number of data entries in OMS.NOTE: Can then narrow down on type of data, as shown in next queryMICROSOFT DOCS: search | 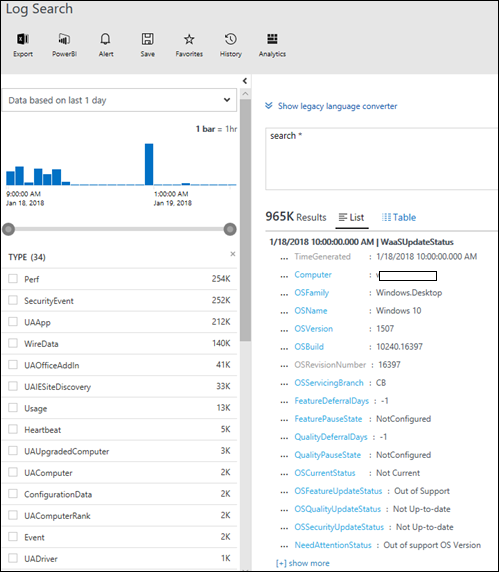 |
| 2) | search * | summarize count() by Type | summarize count() All collected data Summarized by Type of data, providing the count for each type of dataMICROSOFT DOCS: search MICROSOFT DOCS: summarize | 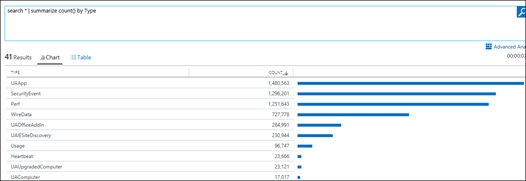 |
| 3) | search "error" | Search for KeywordSearch all collected data for the word "error".NOTE: By default, search is NOT Case Sensitive, so will also fine ERROR and ErrorUse the Kind parameter to make case-sensitive:search kind=case_sensitive "Error"MICROSOFT DOCS: search | 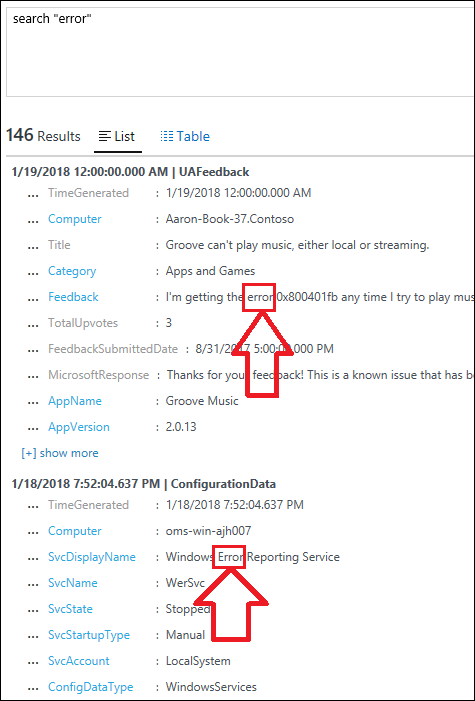 |
| 4) | search in (SecurityEvent) "*Admin*" | InSearch in the SecurityEvent Table for the substring "Admin"NOTE: The SecurityEvents Table contains events from the Windows Security Event Log – requires Security and Audit Solution)MICROSOFT DOCS: String Operators (including in) | 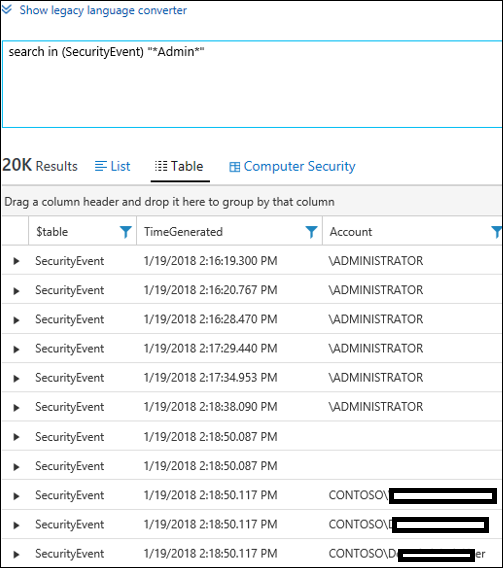 |
| 5) | Event| where TimeGenerated > ago(1d) | summarize count()Event| where TimeGenerated > now(-1d) | summarize count() | ago / nowBoth of these queries produce the same result – The total count of Events generated within the last dayNOTE: m can be used for minutes, h can be used for hoursMICROSOFT DOCS: ago() MICROSOFT DOCS: now() MICROSOFT DOCS: Date Time Timespan Arithmetic MICROSOFT DOCS: DATE TIME TUTORIAL | 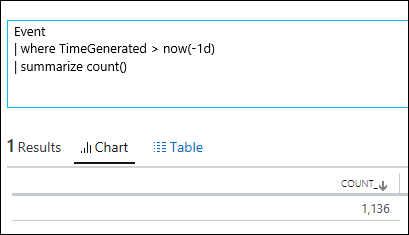 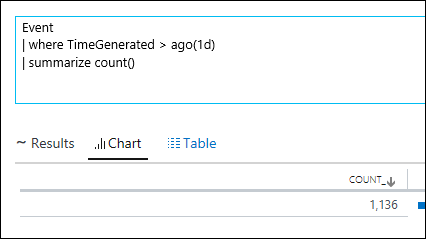 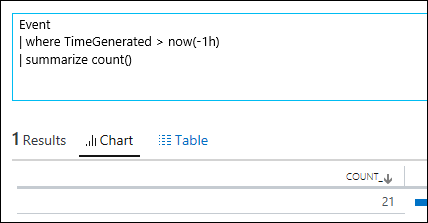 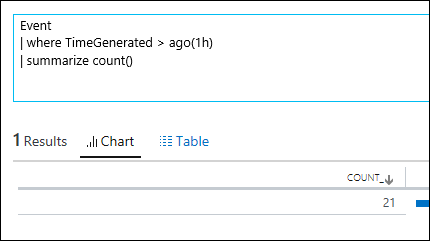 |
| 6) | search *| where TimeGenerated > ago(1d)| summarize count() by Type | search, ago and summarizeCombination of aboveMICROSOFT DOCS: search MICROSOFT DOCS: ago() MICROSOFT DOCS: summarize | 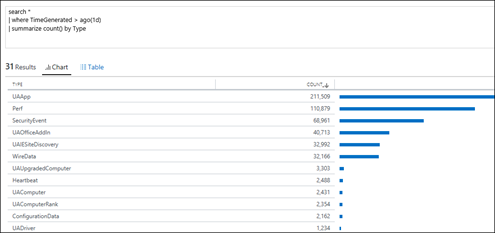 |
| 7) | Event | All Event Data (stored in 'Event' TableNOTE: This does not include SecurityEvents (see below)MICROSOFT DOCS - Getting Started With Queries (includes table-based queries and search-based queries) | 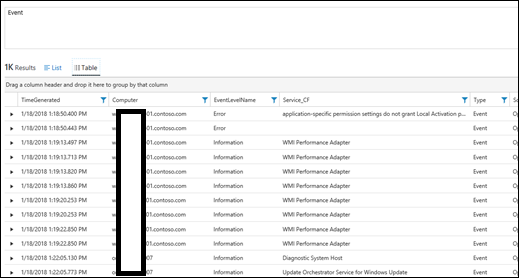 |
| 8) | SecurityEvent | All Security EventsNOTE: Requires Security and Audit solution which collects security eventsNOTE: Check out the Computer Security button that shows up when you query on these eventsMICROSOFT DOCS - Getting Started With Queries (includes table-based queries and search-based queries)
|
Note the 'Computer Security' panel lights up when you start querying on Security Events!!!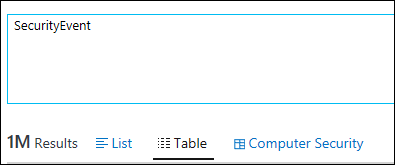 |
| 9) | Perf | All collected Performance Data (stored in 'Perf' Table)NOTE: Collection of performance counters is specified in the Data>Windows Performance Counters / Linux Performance Counters Sections of the SettingsMICROSOFT DOCS - Getting Started With Queries (includes table-based queries and search-based queries) | 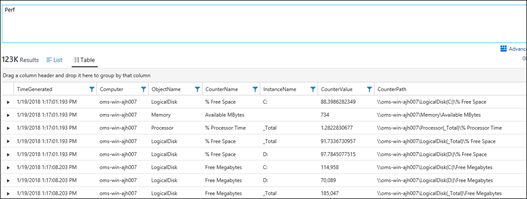 |
| 10) | Alert | All Alert Data (stored in 'Alert' Table)NOTE: This is both OMS alerts and System Center Operations Manager (SCOM) alerts . OMS alerts have a SourceSystem of OMS. Alerts from OpsManager have a SourceSystem of OpsManager | 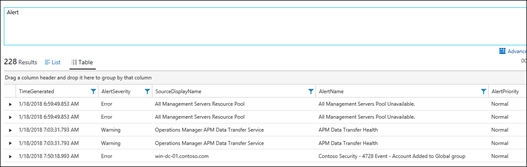 |
| 11) | Alert| where TimeGenerated > ago (4h) | Alerts created in the last 4 hoursMICROSOFT DOCS: ago() | 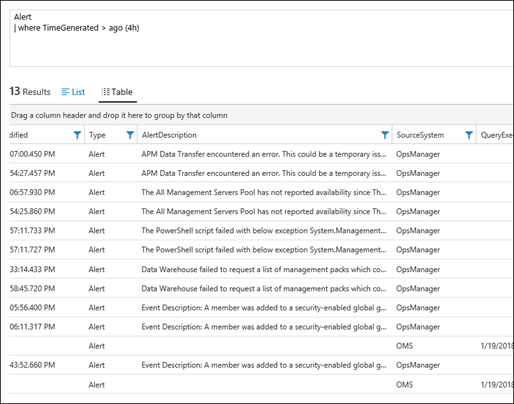 |
| 12) | Event | take 10 | takeReturns 10 Arbitrary records from the Event Table.MICROSOFT DOCS: take | 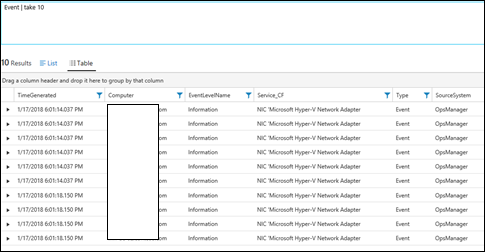 |
| 13) | Perf | take 10 | takeReturns 10 Arbitrary records from the Perf Table.MICROSOFT DOCS: take | 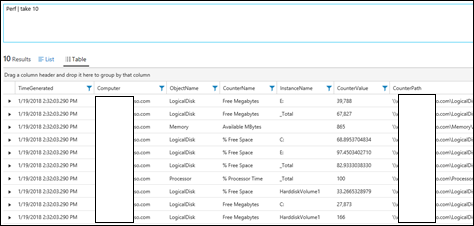 |
| 14) | Alert | take 10 | takeReturns 10 Arbitrary records from the Alert Table.MICROSOFT DOCS: take | 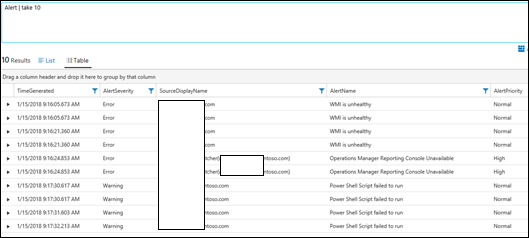 |
| 15) | Event |where EventID == 6005 | EventEvents where the Event ID is 6005NOTE: This is often used for determining System Reboots as it occurs in the Windows System Event log on System StartupMICROSOFT DOCS: where MICROSOFT DOCS: String Operators == | 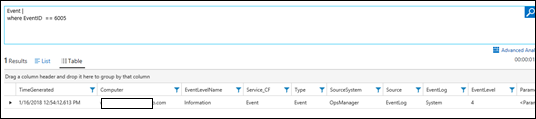 |
| 16) | Event |where Computer == "win-scomms-01.contoso.com" | Event == Events where Computer is"win-scomms-01.contoso.com"MICROSOFT DOCS: where MICROSOFT DOCS: String Operators | 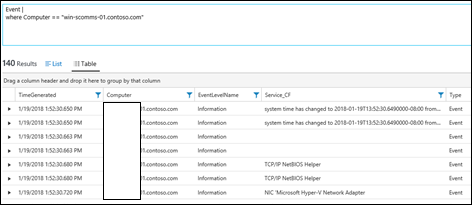 |
| 17) | Event |where Computer == "win-scomms-01.Contoso.com" | == NOTE: '==' is case sensitive so this is where this returns zero resultsMICROSOFT DOCS: where MICROSOFT DOCS: String Operators | 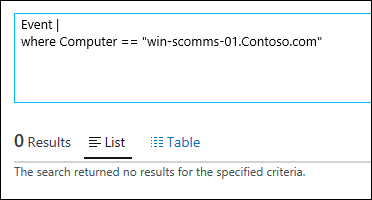 |
| 18) | Event |where Computer =~ "win-scomms-01.Contoso.com" | =~ Search all Results in the Event table where Computer = "win-scomms-01.Contoso.com" but NOT case sensitiveMICROSOFT DOCS: where MICROSOFT DOCS: String Operators | 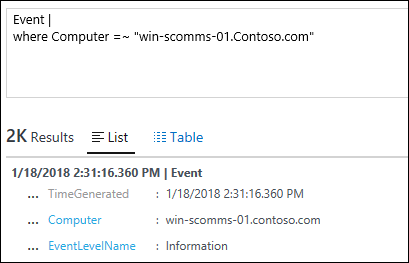 |
| 19) | Event |where Computer != "win-scomms-01.contoso.com"| summarize count() by Computer | != Event where Computer is NOT "win-scomms-01.contoso.com"MICROSOFT DOCS: where MICROSOFT DOCS: String Operators | 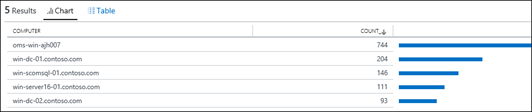 |
| 20) | Perf |where ObjectName == "LogicalDisk" | Performance Data where the Object name is Logical DiskNOTE: remember case-sensitive with == but case insensitive with =~MICROSOFT DOCS: where MICROSOFT DOCS: String Operators | 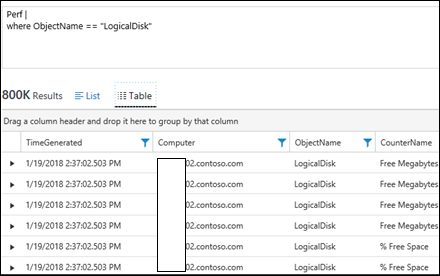 |
| 21) | Event | sort by TimeGenerated desc | sort by … descsort by … ascEvents sorted by most recent firstNOTE: Desc can be substituted for ascNOTE: The time dropdown control on the top left will affect the timeframe of results returnedMICROSOFT DOCS: sort | 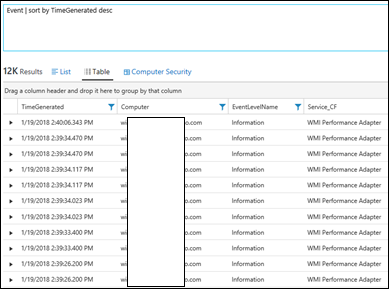 NOTE: This will affect your query NOTE: This will affect your query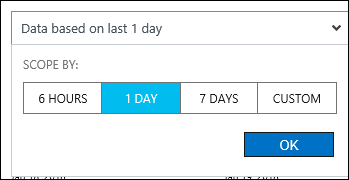 |
| 22) | Event |where EventLevelName == "Error" or EventLevelName == "Warning" | orEvents with an Error OR Warning LevelNOTE: == is case-sensitiveNOTE: OR / Or are not accepted – has to be all lower-caseMICROSOFT DOCS: where MICROSOFT DOCS: String Operators | 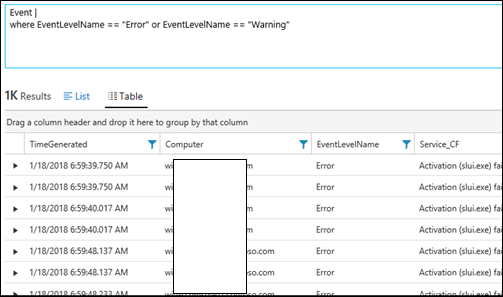 |
| 23) | Event |where EventLevelName == "Error" and EventLog == "System" | andEvents that are from the event system log And of an 'error' levelNOTE: == is case-sensitiveNOTE: AND / And are not accepted – has to be all lower-caseMICROSOFT DOCS: where MICROSOFT DOCS: String Operators | 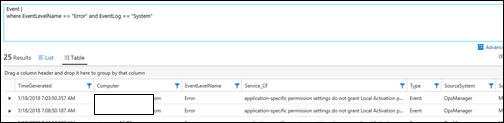 |
| 24) | Event |where EventLevelName == "Error" and EventLog == "System"| project TimeGenerated, Computer, EventID, EventLevelName, EventLog | projectSelect ColumnsEvents that are from the event system log And of an 'error' level. Uses project to narrow results to fields shown | 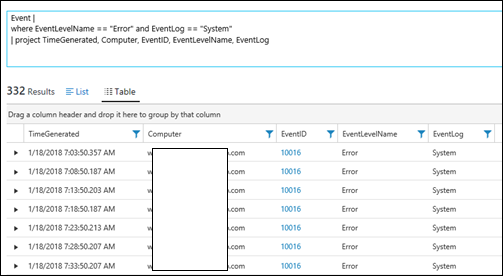 |
| 25) | Event |where EventLevelName == "Error" and EventLog == "System"| project Created_Time=TimeGenerated, Computer, EventID, EventLevelName, EventLog | projectRename ColumnsEvents that are from the event system log And of an 'error' level. Uses project to narrow results to fields shown and also rename the TimeGenerated field to Created_TimeMICROSOFT DOCS: project |  |
| 26) | Event |where EventLevelName == "Error" and EventLog == "System"| project Created_Time=TimeGenerated, Computer, EventID, EventLevelName, EventLog, Month_Of_The_Year=getmonth(TimeGenerated) | projectAdd a calculated columnEvents that are from the event system log And of an 'error' level. Uses project to narrow results to fields shown and also rename the TimeGenerated field to Created_Time and add an extra calculated field which gets the month of the year from the TimeGeneratedMICROSOFT DOCS: project | 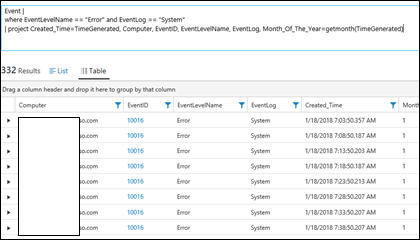 |
| 27) | Event |where EventLevelName == "Error" and EventLog == "System"| project Created_Time=TimeGenerated, Computer, EventID, EventLevelName, EventLog, Month_Of_The_Year=getmonth(TimeGenerated)| extend PST_TIME = Created_Time-8h | extendAdd a Calculated ColumnAdds to all columns.Events that are from the event system log and of an 'error' level. Uses project to narrow results to fields shown and also rename the TimeGenerated field to Created_Time and add an extra calculated field which gets the month of the year from the TimeGeneratedNOTE: Have to use the renamed name of the field Created_Time rather than TimeGenerated here.MS DOCS: extend | 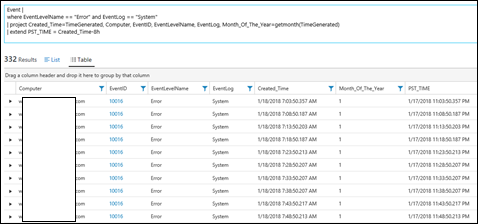 |
| 28) | Event| where EventID == 7036 | distinct Computer | distinctEvery computer that has a 7036 event, showing the computer onceMICROSOFT DOCS: distinct | 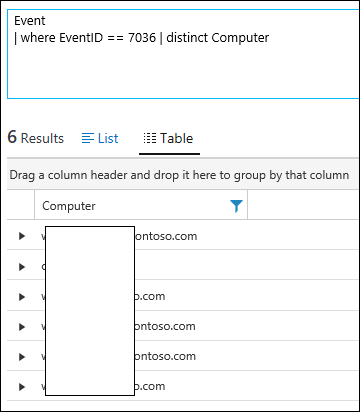 |
| 29) | Perf| summarize count() by ObjectName | PerfAll Performance data summarized by Object NameMICROSOFT DOCS: summarize | 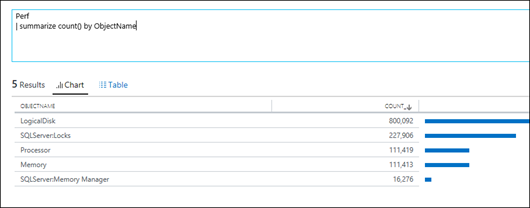 |
| 30) | Perf| summarize count() by CounterName | PerfAll Performance data summarized by Counter NameMICROSOFT DOCS: summarize | 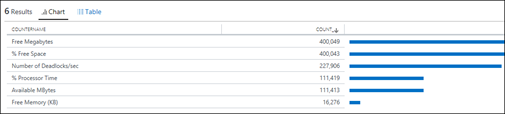 |
| 31) | Perf| summarize count() by Computer | PerfAll Performance data summarized by ComputerMICROSOFT DOCS: summarize | 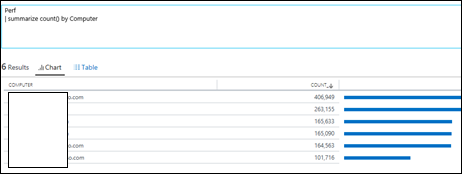 |
| 32) | Perf| where TimeGenerated > ago(30m) | PerfPerformance data created in the last 30 minutesMICROSOFT DOCS: ago() | 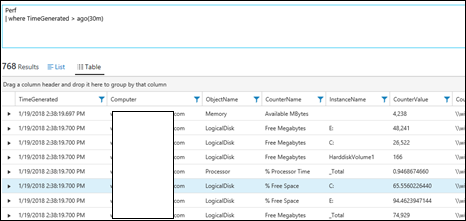 |
| 33) | Perf| summarize count() by bin(TimeGenerated,30m) , Computer | binPerformance data summarized based on TimeGenerated rounded to the closest 30 minutesMICROSOFT DOCS: bin() | 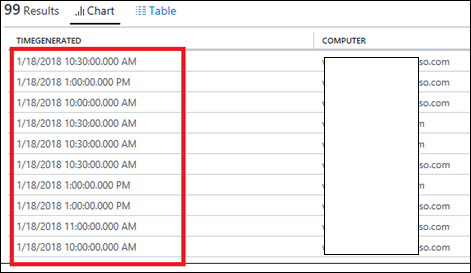 |
| 34) | Perf| summarize Total_Number= count() by bin(TimeGenerated,1d)| where Total_Number > 400000 | Calculated fieldTotal number is the number of performance samples per day, only showing where the number was over 400000MICROSOFT DOCS: bin() MICROSOFT DOCS: Count MICROSOFT DOCS: summarize | 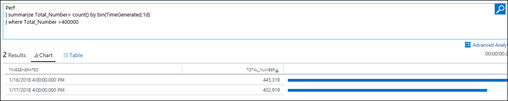 |
| 35) | Perf| where ObjectName == "Processor" and CounterName == "% Processor Time"| summarize avg(CounterValue) by Computer, bin(TimeGenerated, 5min)| render timechart | render timechartProcessor>% Processor Time Data by Computer, rounded to the closest 5 minutes, rendered into a timechartMICROSOFT DOCS: Tutorial - Dashboards MICROSOFT DOCS - Tutorial: Charts | 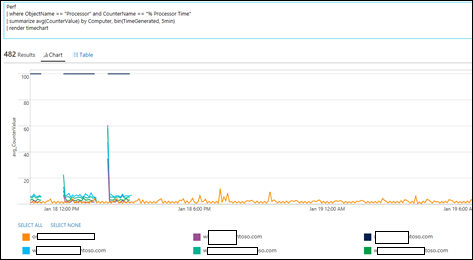 |
| 36) | SecurityEvent| where EventID == 4624| project Computer, Account, TargetLogonId, LogonTime=TimeGenerated| join kind= inner ( SecurityEvent | where EventID == 4634 | project TargetLogonId, LogoffTime=TimeGenerated) on TargetLogonId| extend Duration = LogoffTime-LogonTime| project-away TargetLogonId1| top 10 by Duration desc | joinAll Security Events where logon joined to logoff time, based on user ID, adding a calculated duration (of logged on time) field, reoving the targetlogonid1 field, narrowed to the top 10 based on durationReference: MICROSOFT DOCS: Joins | 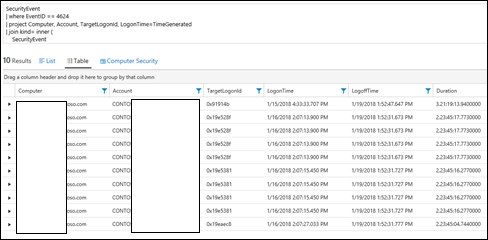 |
| 37) | Event| summarize makelist(EventID) by Computer | makelistshow all Events in the form of a list, summarized by computerNOTE: Does not include Security Events are those are stored in the SecurityEvent table – not the Event tableMICROSOFT DOCS: makelist() | 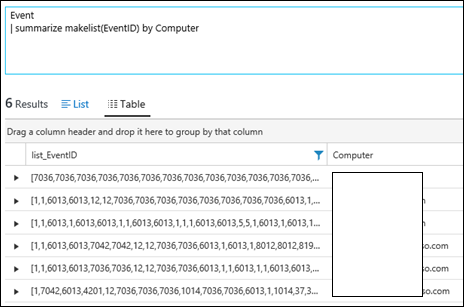 |
| 38) | Event| summarize makeset(EventID) by Computer | makesetshow all Events in the form of a list, summarized by computerNOTE: Does not include Security Events are those are stored in the SecurityEvent table – not the Event table.NOTE: Differs from Makelist as shows unique distint IDs in the set, not duplicates as makelist shows.MICROSOFT DOCS: makeset() | 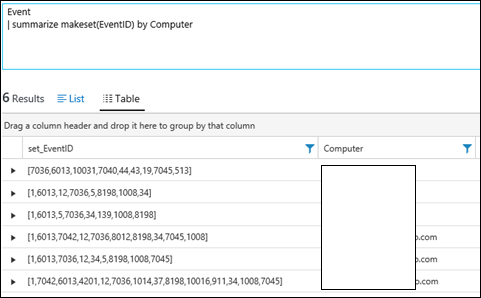 |
| 39) | Event | where Computer == "ComputerName"| make-series count() on TimeGenerated in range(datetime(01-15-2018),datetime(01-19-2018), 1d) | make-seriesCombines results (multiple days in this case) into a single valueMICROSOFT DOCS: make-series | 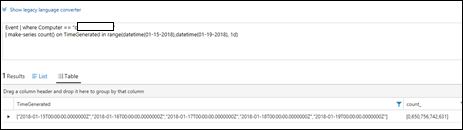 |
| 40) | Event| evaluate autocluster_v2() | Evaluate autocluster_v2() Looks for patterns in data specifiedReference:MICROSOFT DOCS: autocluster | 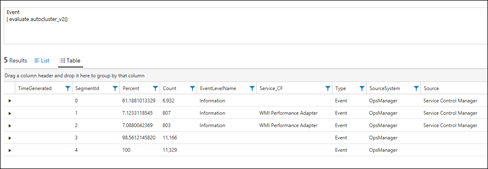 |
| 41) | Event| evaluate basket() | evaluate basket (finding frequent patterns)Reference:MICROSOFT DOCS: basket | 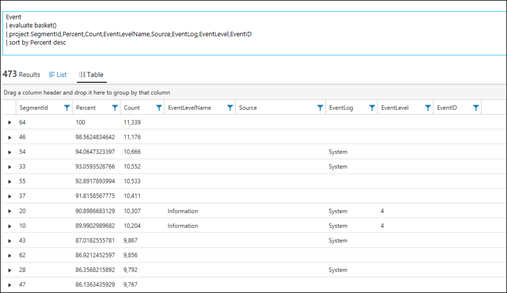 |
| 42) | Event | evaluate diffpatterns(Computer,"Computer1Name","Computer2Name") And then to verify….Event| where EventID == "7036"| summarize count() by Computer | evaluate diffpatterns() Above shows Computer1 (CountA and PercentA) has a lot more 7036 events than Computer2 (CountB and PercentB). We can prove that by running our count:DIFFPATTERNS (comparing patterns)MICROSOFT DOCS: diffpatterns | 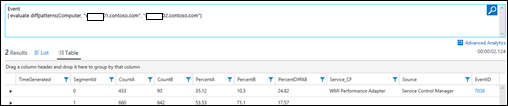 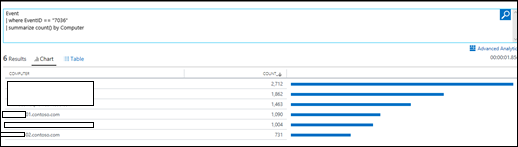 |
| 43) | Event| where Computer == "ComputerName"| make-series y = count() on TimeGenerated in range(datetime(01-15-2018),datetime(01-19-2018), 1d)| extend (RSquare,Slope,Variance,RVariance,Interception,LineFit )=series_fit_line(y) | render timechart | series_fit_linefind the trend of how many events are created per dayNOTE: run in the advanced analytics portal to see the timechart--LINEAR REGRESSION (finding trend)Linear Regression (line of best fit)MICROSOFT DOCS: Linear Regression | 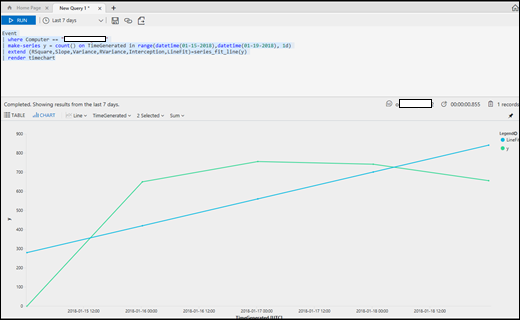 |
| 44) | Event | where Computer == "ComputerName"| make-series count() on TimeGenerated in range(datetime(01-15-2018),datetime(01-19-2018), 1d) | extend outliers = series_outliers(count_) | outlierDetects anomalies so in the makeseries list that was produced, the first value (0) is an anomaly to the rest of the data (650, 756, 742, 659).The anomaly of 0 is represented by -7.4. All the other values are represented by 0.x numbersMICROSOFT DOCS: outlier | 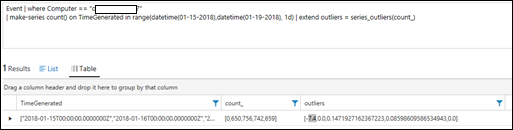 |
Here is a list (not finite) of Tables that can be queried, together with the solution that brings that type of data in:
| Table / Data Type Name (can search using just this in a query to return all records | Solution |
| ADAssessmentRecommendation | AD Health Check (Previously called AD Assessment) |
| ADReplicationResult | AD Replication Status |
| Alert | Alert Management |
| AlertHistory | Alert Management |
| AzureActivity | Activity Log Analytics |
| ConfigurationChange | Change Tracking |
| ConfigurationData | Change Tracking |
| Event | Settings>Data>Windows Event Logs |
| Heartbeat | Agent Health |
| NetworkMonitoring | Network Performance Monitor |
| Operation | OMS Operations – Computer being assessed by a solution pack etc |
| Perf | Settings>Data>Windows Performance Counters |
| ProtectionStatus | Malware Assessment |
| SecurityAlert | Security And Audit (Can be viewed in Azure Security Center) |
| SecurityBaseline | Security And Audit |
| SecurityBaselineSummary | Security And Audit |
| SecurityDetection | Security And Audit |
| SecurityEvent | Security And Audit |
| ServiceMapComputer_CL | Service Map |
| ServiceMapProcess_CL | Service Map |
| SQLAssessmentRecommendation | SQL Healthcheck (Was previously called SQL Assessment) |
| Syslog | Settings>Data>Syslog |
| UAApp | Upgrade Readiness |
| UAComputer | Upgrade Readiness |
| UAComputerRank | Upgrade Readiness |
| UADriver | Upgrade Readiness |
| UADriverProblemCodes | Upgrade Readiness |
| UAFeedback | Upgrade Readiness |
| UAIESiteDiscovery | Upgrade Readiness |
| UAOfficeAddIn | Upgrade Readiness |
| UAProposedActionPlan | Upgrade Readiness |
| UASysReqIssue | Upgrade Readiness |
| UAUpgradedComputer | Upgrade Readiness |
| Update | Update Management |
| UpdateSummary | Update Management |
| Usage | Builtin Usage area of OMS |
| WaaSDeploymentStatus | Update Compliance |
| WaaSUpdateStatus | Update Compliance |
| WireData | WireData |