Heat maps in SQL Server Reporting Services 2005
Warm up your users this winter with heat maps in SQL Server 2005:
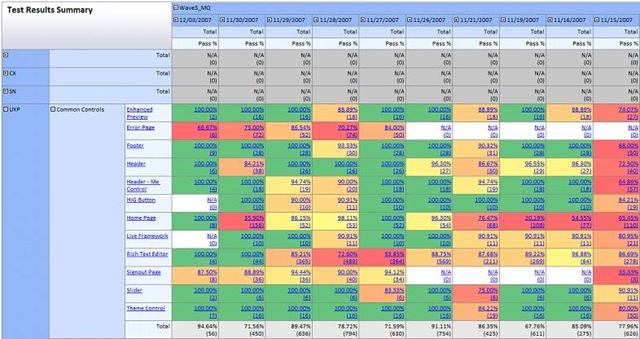
This report was created by one of our testing gurus, Patrice Brassard, and uses a to show up a dll he has written in c#. The code was used to simplify the process of applying conditional formatting in every cell of the report.
The DLL contains a static public method:
public static string GetColor(decimal redStartVal, decimal yellowStartVal, decimal greenStartVal, decimal val)
where:
- redStartVal represents the value where a pure red would be used
- yellowStartVal represents the value where a pure yellow would be used
- greenStartVal represents the value where a pure green would be used
- val is the value where you need to get a heat map colour
The function returns a string corresponding to the Hex value of the colour.
The example report above represents test results so Patrice wanted only 100.00% to be shown green (i.e.99.99% should be yellow) so he used the following values:
WLX_SSRS_Utils.HeatMap.GetColor(70.0, 99.99, 100.00, (Sum(Fields!RawPass.Value) / (Sum(Fields!RawPass.Value) + Sum(Fields!RawFail.Value) + Sum(Fields!RawNotRun.Value))) * 100.0)).
Please note that the attached DLL that needs to be on both your dev machine and the SSRS server:
- On the dev machine (say your PC), it needs to be deployed in %programfiles%\Microsoft Visual Studio 8\Common7\IDE\PrivateAssemblies
- On the reporting server, it needs to be deployed in %ProgramFiles%\Microsoft SQL Server\MSSQL.x\Reporting Services\ReportServer\bin
Technorati Tags: SQL Server 2005,Reporting Services,conditional formatting