Lean and Mean

When you build a cube in analysis services it is very easy to expose every attribute in every dimension to the user. You can also add-in every measure and if you don't feel that's enough then you can create your own calculated members to add to the users' fun.
Once you have given the users every thing they asked for you can now sit back and relax just like on the IT crowd.
I would say that at this stage the work is less than half done. A raw cube is like your digital music collection before you've tagged it. It's all in there but you can't find anything. What your users need even, if they don't tell you, is some direction and guidance to make sense of the monster you have created.
There are several things you can do in the cube to help with this:
- Use security to limit what users are allowed to use. Security can be used to hide attributes and measures and can also limit the users to certain slices of a cube such as only allowing a regional manager to see data for their region.
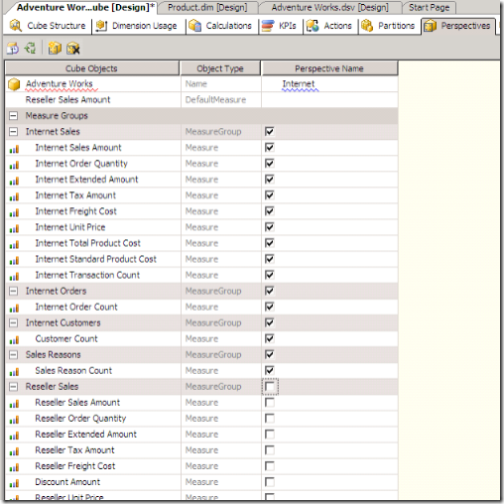
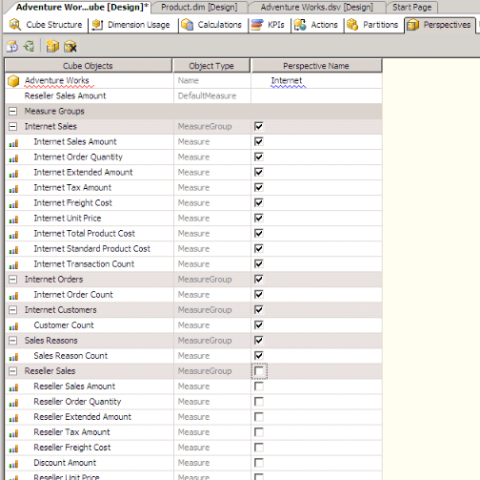
- Create a perspective for each type of users. Perspectives are another tab on the cube designer in BI Develpment Studio (BIDS). Here you can limit which attributes and measures are available from the base cube in as in the screngrab below where I have created a perspecive called Internet which won't have the Reseller Sales measure group in. Perspectives are not a security device and all perspectives are available to users who have access to the underlying cube and they respect the security of the cube on which they are built.
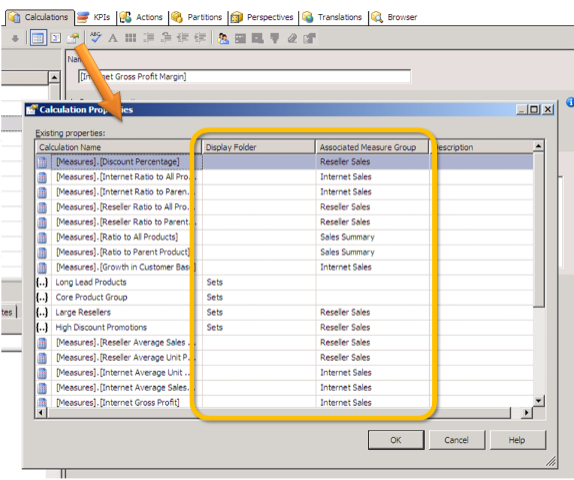
- Organise your attributes and measures into display folders. Display folders are a property of attributes and can also be applied to base measures and calculated memebers. To do this for calculated members to select the associated measure group or display folder for them:
The other really big thing you can do to help your users is document what you have created. This needs ot be done in two ways:
- You need a technical document to maintain and adapt the cube. If your cube is successful you will be asked to change it as the users get more sophisticated and to meet new business priorities. BI Documenter is a good tool for this as you can save the output as html and post it for all to see. Check out the trial and if you like buy it.
- More importantly you need to define and catalogue what is in the cube in a way that the users can understand. An effective way to do this is to get them to do it for you by designing a standard for defining the layout of requirements documents so that these can be tagged and referred to from the end user tool. Get back to me if this is of interest and I'll go into detail in another post.
To conclude business intelligence is there to make sense of the data in an organisation and so writing coool MDX and buying a stonking 16 way server is the easy bit. The hard bit is encouraging them to use it and to get the best out of it.
Technorati tags: BI, Business intelligence, Analysis Services, OLAP