CRM 2011 and SharePoint 2010 Integration - Part 2 Continued….
Technorati Tags: Excel Services sharepoint 2010,crm sharepoint integration,sharepoint crm integration,excel services sharepoint 2010
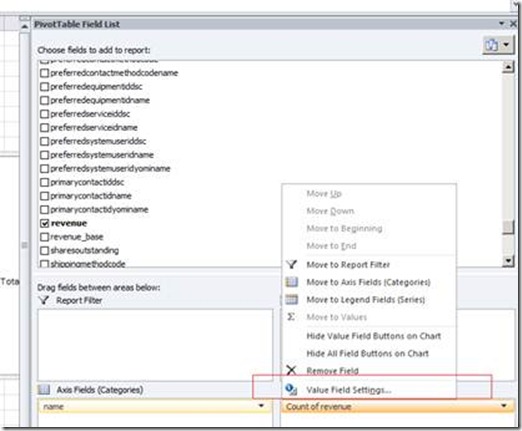
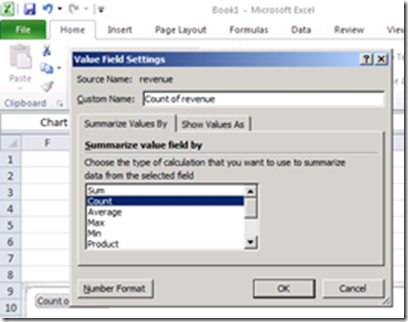
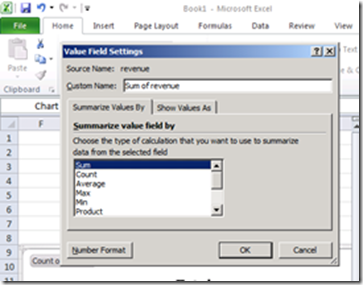
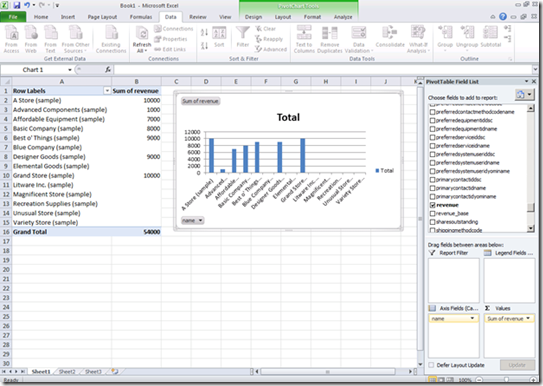
By default Count is selected, change it to Sum and click OK
Now we see the table and the chart correctly
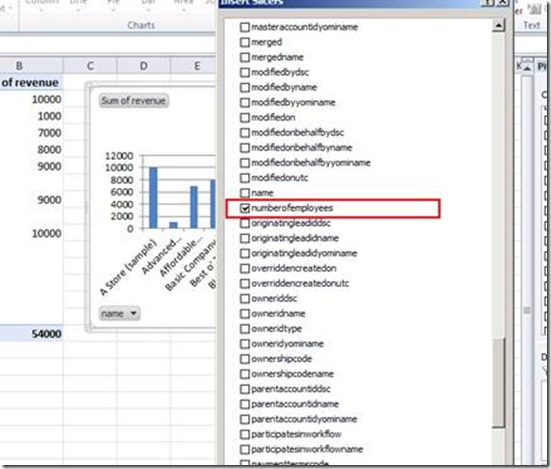
Now the next job is to Add a Slicer that will filter the chart and table based on the number of employees. Select the Chart by clicking it once and then Click Insert and select slicer
Select “numberofemployees” and click OK
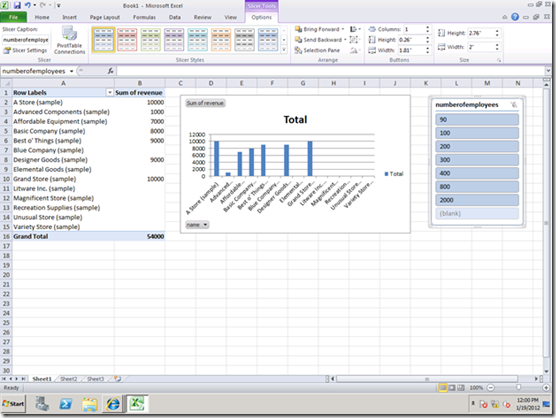
You will now be able to see some meaning ful report
Task 6
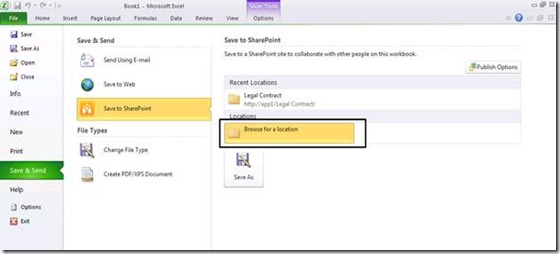
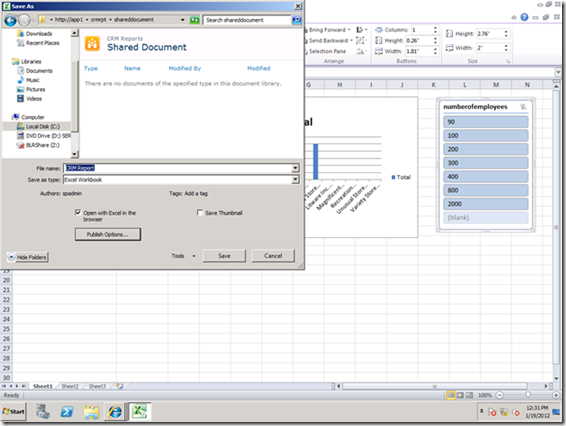
Now the real hero comes into picture, the Excel Services. Click on the file>Save & Send> Save to SharePoint > double click on “Browser for a location” and locate the SharePoint document library location where the Excel report will be saved
Navigate to shared document library
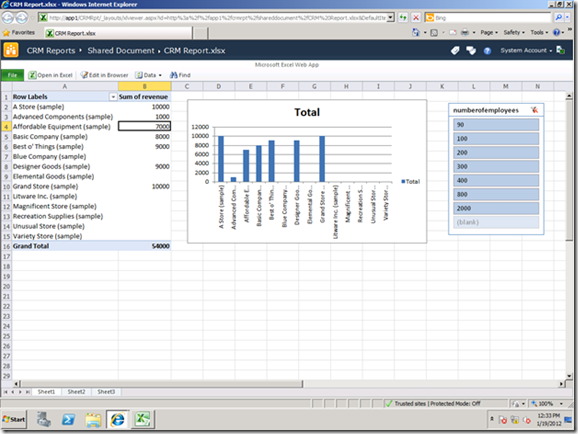
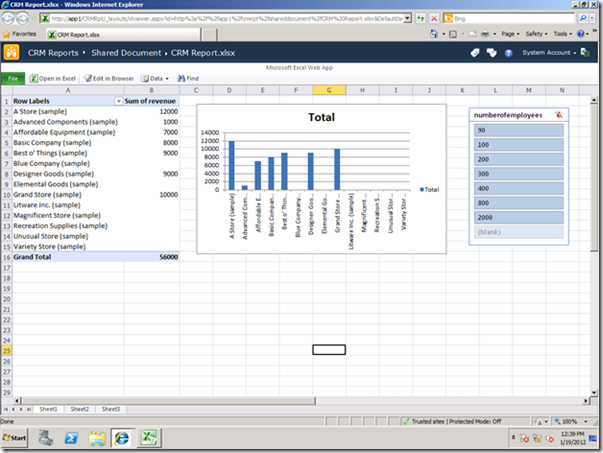
As soon as you save you see the report in the browser
Verify if its working by selecting the “number of employee” slicer
And yes it does J
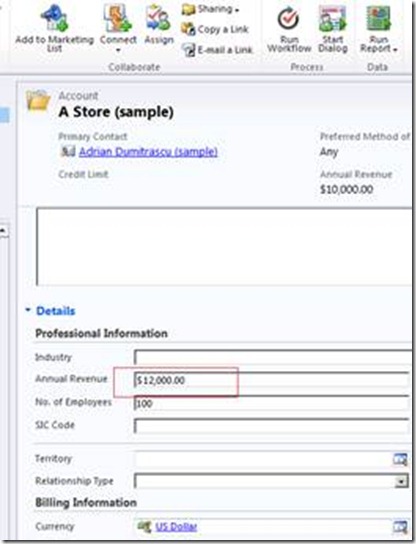
Ok what happens when the CRM data changes ? Try it – Open an CRM account and change the revenue value , I did for “A store (sample)” frm 10000, to 12000.
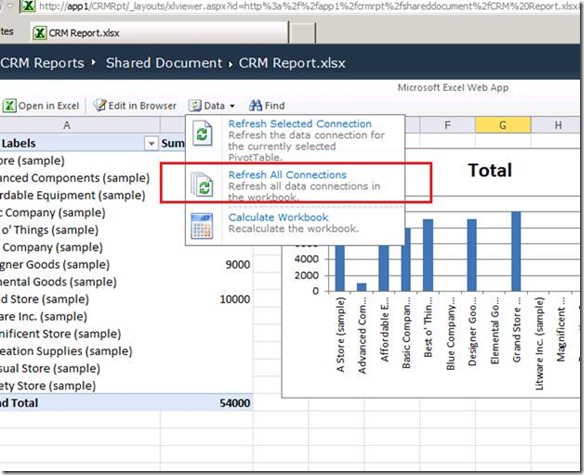
Now go back to the excel service report and click Data> refersh all connection
And see the smooth update of data
And this way you can hopefully build complex and more meaning ful reports and publish it in SharePoint.
Enhance this ?
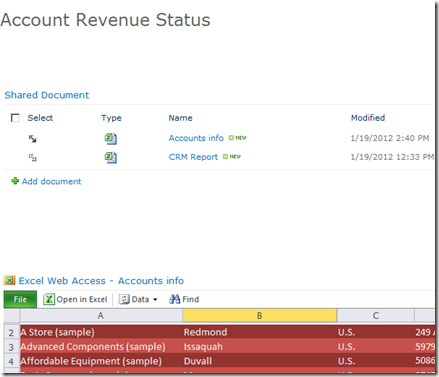
If you want to show/display the excel workbook anywhere in SharePoint, you can use the Built in “Excel Web Access web part”
Open your SharePoint site and edit the page and add a webpart “Excel Web Access”
Click Add and see the web part added. Now open web part properties
You will see the properties
In the workbook Box enter the excel work book location, in my case - \crmrpt/shareddocument/CRM report.xlsx. Click Apply.
Further we can just have the chart shown in the site
Change the web part property, Enter Named Item to Chart 1 (This is the chart object’s name), if you want to verify open excel and see the chart property
And It just shows the chart on the home page,
To get the chart name see in the Excel, click on the chart object to select it and see the name in ribbon.
Further Enhance this using Connected Web parts
If you have several reports in the library AND you want to just have click and see behavior we can create connections between web parts to have that kind of experience. Just ensure that you have multiple reports in the library.
Edit the home page, Add the library that has Excel Reports in it AND add the Excel Web Access webpart on that same page, Configure the Excel Web access to show a report (this would be the default report that it will show). Now click on the menu of the Library >Connections>Send Row of Data To > Excel Web Access Web part.
In the following popup menu
Got to Tab 2. Configure Connection> and set the Field name to Document URL> and Finish. Now save and Close the page.
See it in action, by selecting the report
With that I will come back with the 3rd and the 4th part soon. Thanks for reading.

![clip_image004[4] clip_image004[4]](https://msdntnarchive.blob.core.windows.net/media/TNBlogsFS/prod.evol.blogs.technet.com/CommunityServer.Blogs.Components.WeblogFiles/00/00/00/88/50/metablogapi/1460.clip_image0044_thumb_401ADA71.png)
![clip_image002[4] clip_image002[4]](https://msdntnarchive.blob.core.windows.net/media/TNBlogsFS/prod.evol.blogs.technet.com/CommunityServer.Blogs.Components.WeblogFiles/00/00/00/88/50/metablogapi/8322.clip_image0024_thumb_10B87D73.jpg)
![clip_image004[6] clip_image004[6]](https://msdntnarchive.blob.core.windows.net/media/TNBlogsFS/prod.evol.blogs.technet.com/CommunityServer.Blogs.Components.WeblogFiles/00/00/00/88/50/metablogapi/4113.clip_image0046_thumb_16CFA441.png)
![clip_image006[4] clip_image006[4]](https://msdntnarchive.blob.core.windows.net/media/TNBlogsFS/prod.evol.blogs.technet.com/CommunityServer.Blogs.Components.WeblogFiles/00/00/00/88/50/metablogapi/4604.clip_image0064_thumb_583A30CD.jpg)
![clip_image008[4] clip_image008[4]](https://msdntnarchive.blob.core.windows.net/media/TNBlogsFS/prod.evol.blogs.technet.com/CommunityServer.Blogs.Components.WeblogFiles/00/00/00/88/50/metablogapi/1452.clip_image0084_thumb_12F1B3D7.png)
![clip_image010[4] clip_image010[4]](https://msdntnarchive.blob.core.windows.net/media/TNBlogsFS/prod.evol.blogs.technet.com/CommunityServer.Blogs.Components.WeblogFiles/00/00/00/88/50/metablogapi/4760.clip_image0104_thumb_5E4131CE.png)
![clip_image012[4] clip_image012[4]](https://msdntnarchive.blob.core.windows.net/media/TNBlogsFS/prod.evol.blogs.technet.com/CommunityServer.Blogs.Components.WeblogFiles/00/00/00/88/50/metablogapi/3187.clip_image0124_thumb_5F0971EB.jpg)
![clip_image014[4] clip_image014[4]](https://msdntnarchive.blob.core.windows.net/media/TNBlogsFS/prod.evol.blogs.technet.com/CommunityServer.Blogs.Components.WeblogFiles/00/00/00/88/50/metablogapi/1524.clip_image0144_thumb_2EB27768.png)
![clip_image016[4] clip_image016[4]](https://msdntnarchive.blob.core.windows.net/media/TNBlogsFS/prod.evol.blogs.technet.com/CommunityServer.Blogs.Components.WeblogFiles/00/00/00/88/50/metablogapi/6305.clip_image0164_thumb_6969FA71.jpg)
![clip_image002[6] clip_image002[6]](https://msdntnarchive.blob.core.windows.net/media/TNBlogsFS/prod.evol.blogs.technet.com/CommunityServer.Blogs.Components.WeblogFiles/00/00/00/88/50/metablogapi/1680.clip_image0026_thumb_2BACECE8.jpg)
![clip_image004[8] clip_image004[8]](https://msdntnarchive.blob.core.windows.net/media/TNBlogsFS/prod.evol.blogs.technet.com/CommunityServer.Blogs.Components.WeblogFiles/00/00/00/88/50/metablogapi/3731.clip_image0048_thumb_5825F701.png)
![clip_image006[6] clip_image006[6]](https://msdntnarchive.blob.core.windows.net/media/TNBlogsFS/prod.evol.blogs.technet.com/CommunityServer.Blogs.Components.WeblogFiles/00/00/00/88/50/metablogapi/2148.clip_image0066_thumb_5FA140A1.jpg)
