Semantic Logging in ASP.NET MVC
Overview
This post gives you an introduction to Semantic Logging and also provides step by step guide to use Semantic Logging in an application.
Semantic Logging helps us to log structured information to variety of logging destinations. Logging plays major role in an application during troubleshooting or debugging. Poor logging causes problems while troubleshooting an issue in production application.
.NET 4.5 framework introduced a class EventSource in the namespace System.Diagnostics.Tracing which helps us in consuming the Event Tracing for Windows (ETW) infrastructure. ETW infrastructure is built into Windows Operating System to collect events and is proven to be strong for many years now.
Semantic logging can be done in two different ways:
- In-ProcessIn this scenario, all the components run in the same process as your application. Hence the event generator (application), event listeners and event sinks all run in the sample process. If the applicaiton process crashes for some reason, we can not guarantee if the event gets logged in the destination, since all the buffered logs which are yet to be written to the log destination are gone. Enterprise Library Semantic Logging Application Block (SLAB) provides a set of destinations (sinks) to store events. Sinks include SQL server database, rolling file. SLAB also helps us to create custom sink.
- Out-of-ProcessIn this scenario, application interacts with ETW infrastructure of windows to log the events to log destinations. Hence the event generator (application) runs in a different process than event listener. Event listener processes the events to log them to destinations. Enterprise Library Semantic Logging Application Block (SLAB) provides an out-of-proc windows service and console host to process the events generated from ETW.
The below diagram from MSDN highlights the difference between above two approaches:
.png")
Developing ASP.NET MVC Application using the Semantic Logging Application Block in Out-of-Proc mode
Create an ASP.NET MVC project in Visual Studio
Add one more Class Library project to this solution.
Create custom event source in this class library project.
     [EventSource(Name = "Sample-EventSource")]
    public class SampleEventSource : EventSource
    {
        public class Keywords
        {
            public const EventKeywords Application = (EventKeywords)1;
            public const EventKeywords Service = (EventKeywords)2;
            public const EventKeywords Database = (EventKeywords)4;
        }

        public class Tasks
        {
            public const EventTask Page = (EventTask)1;
            public const EventTask DBQuery = (EventTask)2;
        }

        private static SampleEventSource _log = new SampleEventSource();
        private SampleEventSource()
        { }

        public static SampleEventSource Log
        {
            get
            {
                return _log;
            }
        }

        [Event(101, Keywords = Keywords.Application,
            Level = EventLevel.Critical,
            Message = "Application failure: {0} ")]
        public void Failure(string message)
        {
            if (this.IsEnabled(EventLevel.Critical, Keywords.Application))
            {
                this.WriteEvent(101, message);
            }
        }

        [Event(102, Keywords = Keywords.Application,
            Level = EventLevel.Informational,
            Message = "Information: {0}")]
        public void Information(string message)
        {
            if (this.IsEnabled(EventLevel.Informational, Keywords.Application))
            {
                this.WriteEvent(102, message);
            }
        }
    }
Add reference of class library project to ASP.NET MVC application
In ASP.NET MVC application, add one controller and few action methods to generate events from application
     public class HomeController : Controller
    {
        // GET: Home
        public ActionResult Index()
        {
            return View();
        }

        [HttpPost]
        public ActionResult Test()
        {
            return View();
        }

        public ActionResult LogError()
        {
            SampleEventSource.Log.Failure("Error raised from LogError action method of Home controller.");
            return View();
        }

        public ActionResult LogInformation()
        {
            SampleEventSource.Log.Information("Information raised from LogInformation action method of Home controller.");
            return View();
        }
    }
Download and Install PerfView tool from Microsoft Download Centre to view traces collected by ETW
Open PerfView tool, click Collect menu item to start collecting the ETW events
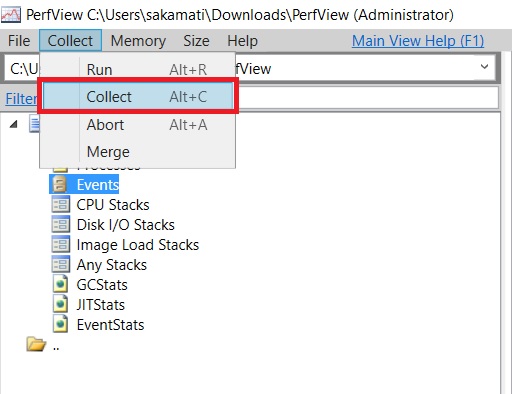
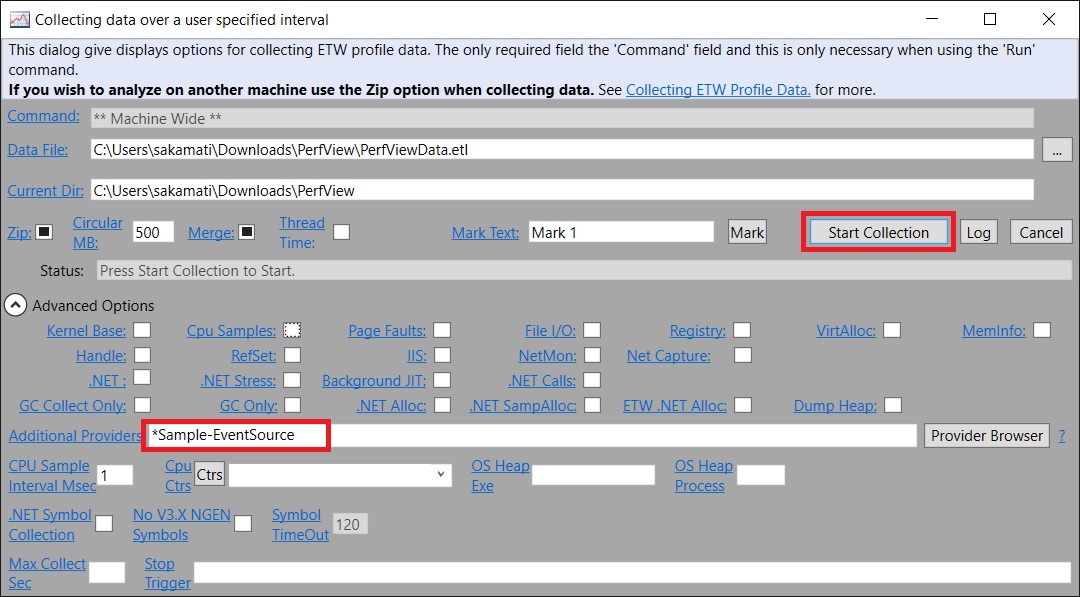
In the new window, enter the provider name / event source name (with star symbol at the start). Click Start Collection button to start collecting the ETW events.
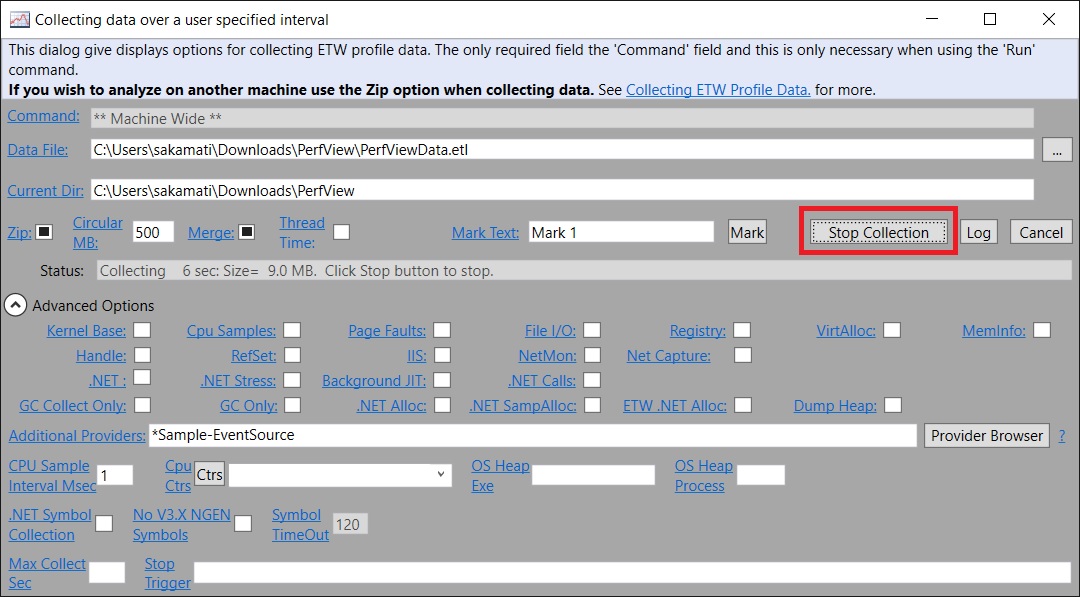
Now, run the sample ASP.NET MVC application, and generate few events from the application
Go back to PerfView, click Stop Collection button to stop collecting events
After few seconds, PerfView tool creates and ETL file, in which we can see the events generated by the application.
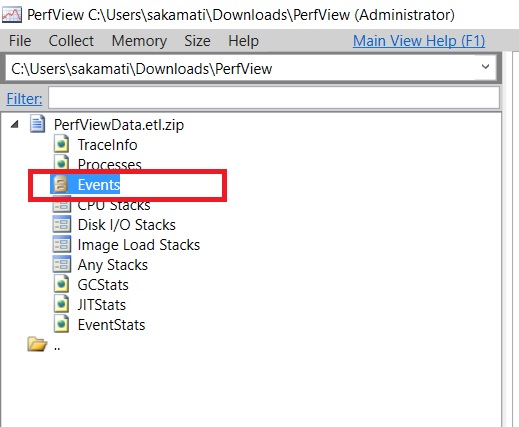
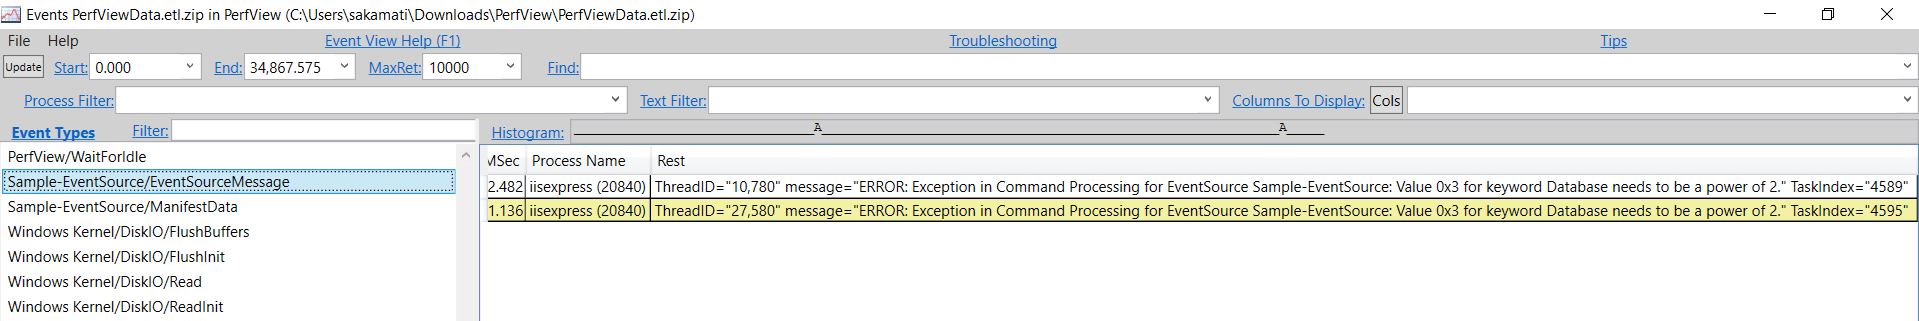
Click Events under the ETL file to see the events captured by PerfView tool. Search for the specific event source to see events generated by our application.
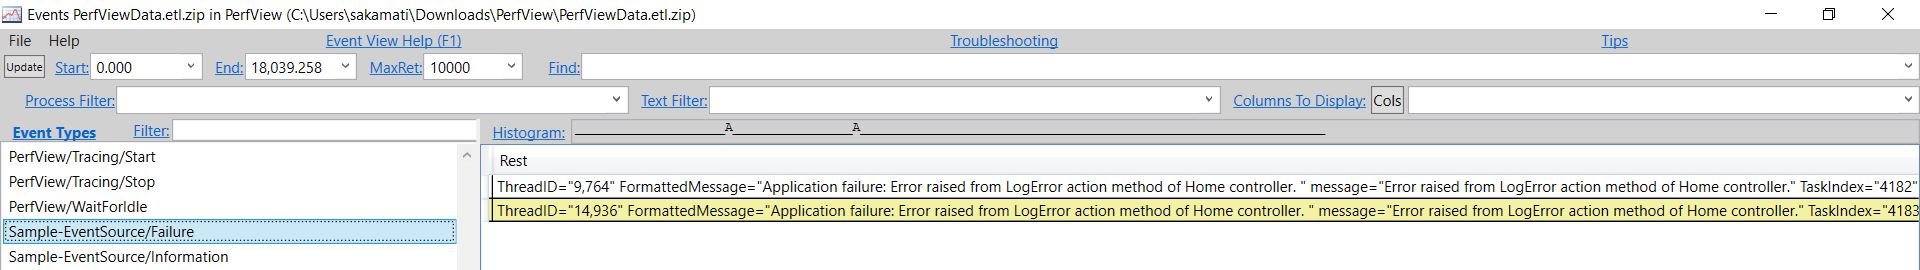
An advantage of using PerfView tool during development is too see if there are any issues with the custom event source. For example, my initial custom event source had an issue which I figured out by running PerfView tool.
Now, let us see how to setup SLAB out-of-process windows console to log the events to flat file destination
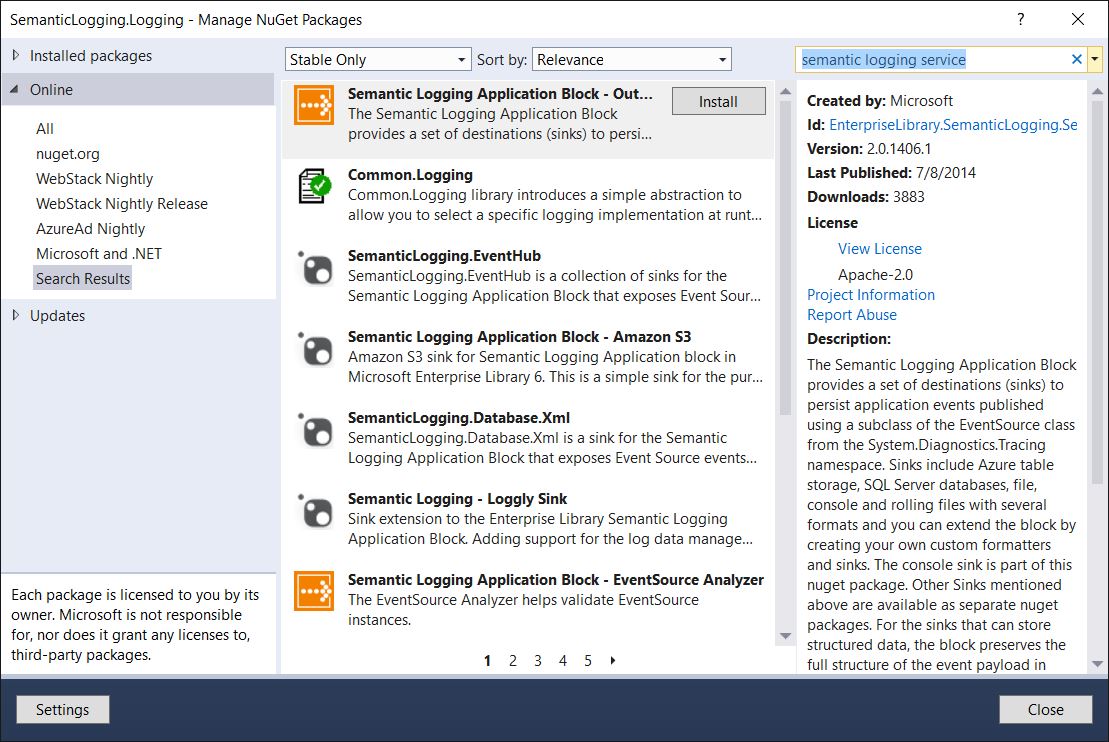
Back to Visual Studio, install the Nuget package - Semantic Logging Application Block - Out-of-process Service
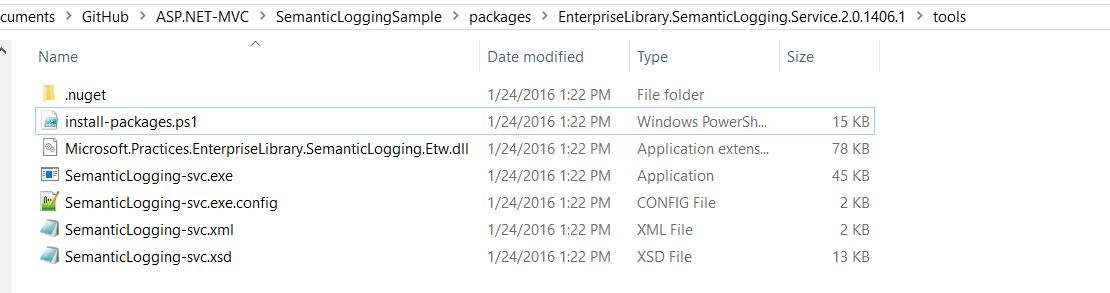
Run PowerShell script install-packages.ps1 from the installed nuget package location to resolve additional dependencies
Update the SemanticLogging-svc.xml file with the required event source and sinks. Let us configure it to receive events from our sample event source and log to a flat file.
 <?xml version="1.0" encoding="utf-8" ?>
<configuration xmlns="https://schemas.microsoft.com/practices/2013/entlib/semanticlogging/etw"
               xmlns:xsi="https://www.w3.org/2001/XMLSchema-instance"
               xsi:schemaLocation="https://schemas.microsoft.com/practices/2013/entlib/semanticlogging/etw SemanticLogging-svc.xsd">
  <traceEventService/>
  <sinks>
    <flatFileSink name="svcRuntime" fileName="SemanticLogging-svc.runtime.log" >
      <sources>
        <eventSource name="Sample-EventSource" level="Error"></eventSource>
      </sources>
      <jsonEventTextFormatter formatting="Indented"/>
    </flatFileSink>
  </sinks>
</configuration>
Run the out-of-process windows console to capture the events generated from our MVC application. Use the following command to run the console host SemanticLogging-svc.exe -c
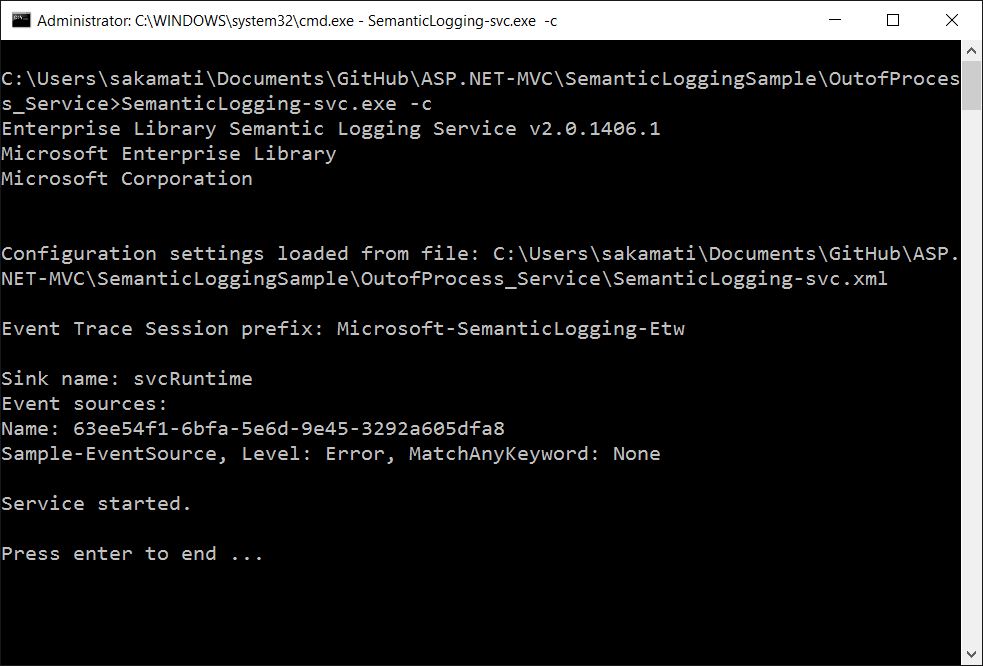
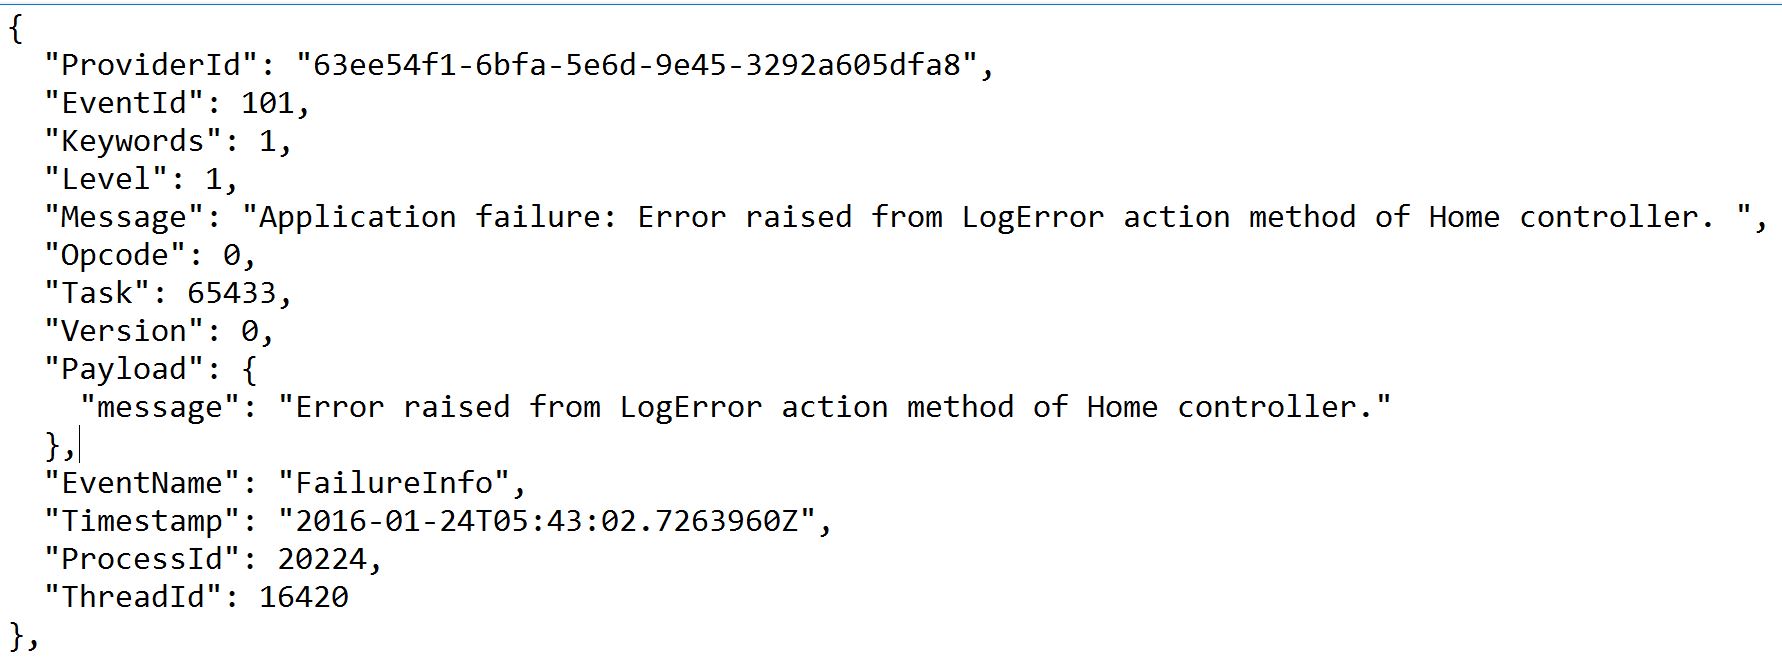
Once again run the sample ASP.NET MVC application, and generate few events from the application. These events are captured by out-of-process console program and are written to flat file. In fact, only Errors are written to flat file since we specified Level=Error in SemanticLogging-svc.xml
Let us see one of the events stored in flat file. We see the event in JSON format, because we specified JSONEventTextFormatter in SemanticLogging-svc.xml
Source code is available in my github here