Search Reporting and SharePoint 2013: Introduction
Reference Script: https://www.microsoft.com/en-us/download/details.aspx?id=43394
This is the first post in a series of posts all about analyzing search usage in a SharePoint 2013 environment. Lots of the concepts here can apply to any search platform, but we’re taking a look specifically at how to extract the raw data from SharePoint 2013 and convert that into actionable intelligence.
Search Reporting and SharePoint 2013: Introduction
So you've just launched a brand new SharePoint 2013 Enterprise Search Center with all the bells and whistles. You've crawled your separate content sources, maybe added some new refiner options, even setup some Promoted Results via Query Rules. Surely all of those features you spent time working on will get plenty of use, right? But how can you measure that? Are users finding what they want? How can you make the most out of your investment?
Fortunately, SharePoint 2013 tracks loads of information about how your users are actually interacting with the system, including but not limited to:
- Users and Sessions
- User Queries
- User Actions (clicks, hovers, etc.)
- Result Impressions
- Refiner Usage
- Promoted Results, Result Blocks, and general Query Rules execution
- Query Origin (Site and Source)
- Client Type (REST API, UI, etc.)
All of this tracked information drives the out-of-the-box search reports, which are a great place to start if you want to check out how search is being used:
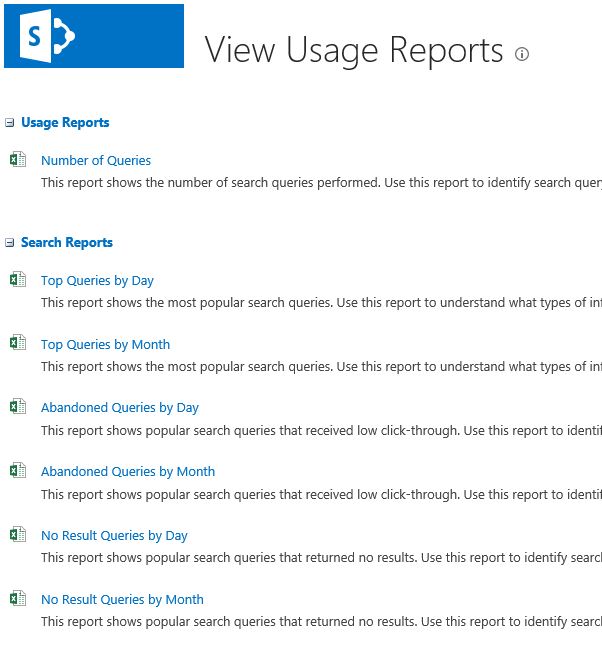
The basics are all here. Top Queries for popular trend tracking; Abandoned Queries for low click through queries; No Results to investigate unfulfilled queries; and Query Rule Usage to track the effectiveness of your custom managed rules. For most administrators, this is plenty of information to effectively manage your search application and it’s a general best practice to review these periodically.
Suppose though that you are looking to get into more detail. Maybe you not only want to see what queries are popular amongst your user base, but you also want to see what those users tend to click on for each particular query. Or even what they don't click on? Are users frequently skipping down to the 6th result in the set before they find what they are looking for? Are they going to the second page of results? What about abandoned searches? Are users frequently rewriting queries in the same way because they didn’t get what they expected the first time?
All of this data is but a SQL query (or two) away. There is currently no programmatic access to this data, but if you are PowerShell savvy, you can get your hands on all of it. Behold, the Link Store Database:
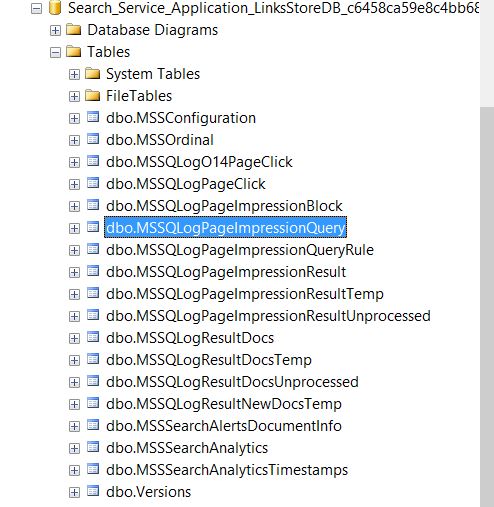
This database holds everything you need to generate your own enterprise search reports. It can be found in whichever farm holds your Search Service Application. There are a significant number of tables here but we will only work with a handful of them, starting with MSSQLogPageImpressionQuery:
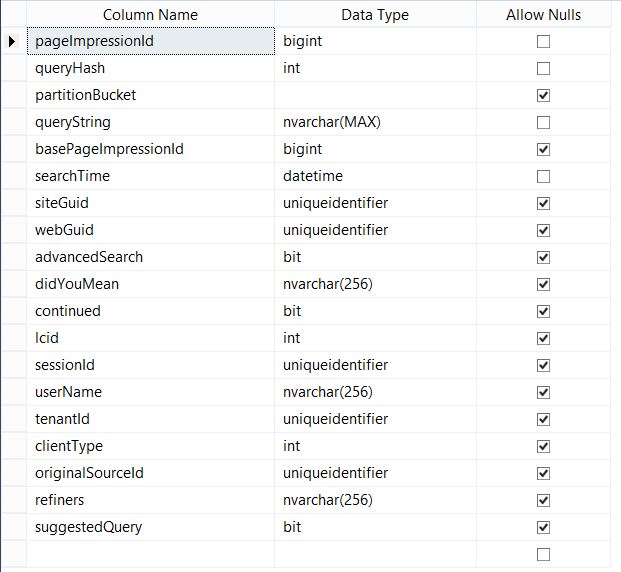
Every search is eventually persisted in this table with a pageImpressionId that is a unique key that relates to the other tables in this database. Each row here represents a search and contains a bunch of useful details:
- When the search happened and where it came from
- Who performed the search and under what session
- The raw query string
- Did the search make use of refiners?
This information is the basis for reports on search volume (broken up by site, source, or any other facet) and query popularity, but we’ll need a few more tables to get into some more interesting reports. Let’s take a look at some of the other useful tables in here and see how we can join this together.
MSSQLogPageImpressionResult |
Contains a reference to each result impression that came back for a particular query. Also tracks how this result was displayed to the user (result block, natural result, etc…). |
MSSQLogResultDocs |
Contains the URI and Title for each of the result impressions. Joining this table in gives us some human readable information about the results that were displayed for our reports. |
MSSQLogPageImpressionQueryRule |
Shows you which query rules (if any) were triggered during each search execution. We’ll need this if we want to be able to track the click through rates of our custom query rules. |
MSSQLogPageClick |
And here it is. This table holds information about what users have clicked on which results per query and what type of click it was. |
I’ll spare you all the gory details of the actual SQL query and will instead direct you towards a set of example PowerShell scripts that will run this for you: https://www.microsoft.com/en-us/download/details.aspx?id=43394
Wrapping this all up in PowerShell lets you interact with all of this query data on a command line and in a common object format. You can dump all of the data out into CSV for consumption by some other technology or do all of your report processing right inside PowerShell and dump just the aggregated statistics instead.
A quick example:
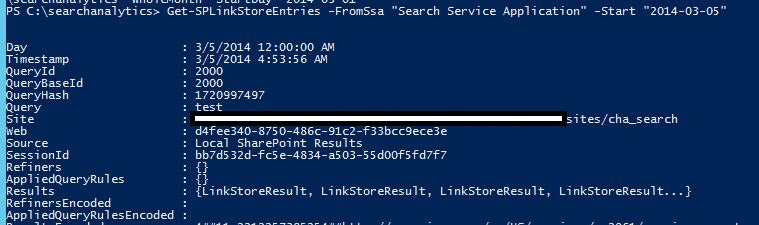
Here we are extracting all search entries for March 5th. This particular query was for the word “test”. You can see the Site that it came from (an Enterprise Search Center in this case), the Source that was queried, the SessionId, no Refiners or Query Rules this time around, and an array of LinkStoreResult objects. This object returned and all of the ones contained inside of it were defined in our helper scripts and are just meant for example purposes. These objects are not part of the SharePoint 2013 space.
Going one step further, let’s store that entry object in a variable called $entry and take a look at Results that were actually clicked:
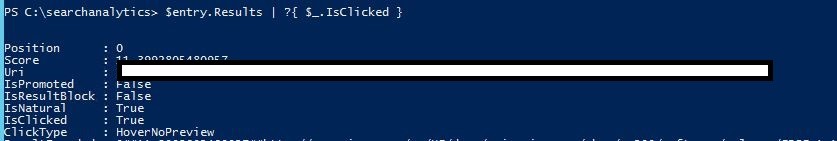
So this particular query ended up getting a Click action (that was actually a hover over) on the first result in the set (position 0). This was a natural result as well and not inside of a result block or promoted.
With this information available, we can now construct our own “Top Queries and Top Clicks” reports, joining together query popularity and what links are actually getting traffic from those popular queries. We can take a look at what results in high result positions are getting passed over the most. We can setup a report to target only specific query text (outside of popular trends). The list goes on.
In the next post, we’ll throw together an example report using these PowerShell scripts and Excel PivotTables and take a look at Popular Queries and those Popular Clicks. Also, if you’ve got any great ideas for new reports, leave some feedback!