How to Use GPUView with Windows Phone
GPUView is one of the most useful tools for graphics and multimedia performance analysis in Windows. You can use it just to get a high level overview of how your application utilizes system resources, or to dive extremely deep to your application's interactions with operating system and hardware accelerators. Whenever I encounter a new performance problem my first action is usually to record an ETL trace and open it in GPUview. Quite often that is the only tool I need to identify the bottleneck and decide what is the right way to get things fixed.
GPUview is an offline tool; you first need to record a trace of the problem using a BAT script shipped with it. Unfortunately Windows Phone does not expose access to command prompt or any other way to execute batch files so this method does not work with phones. However, recent phone SW versions include a diagnostic tool called FieldMedic and with a little bit of work it can be configured to capture a GPUview compatible trace.
Getting Your Phone Ready
If you don't yet have FieldMedic in your phone, install it from Windows Store, or by clicking this link.
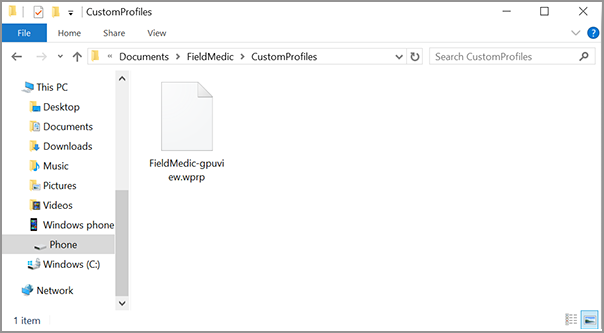
I have created a simple custom profile for FieldMedic that gathers trace data from the most important ETW providers needed by GPUview. Download it from here. After that, connect your phone to your PC's USB port, open Windows Explorer and copy the downloaded FieldMedic-GPUview.wprp file to phone's Documents\FieldMedic\CustomProfiles directory (you might need to create the directory first)
Recording a trace
Now open the FieldMedic application in your phone. Go to "Advanced" page and tap the first field to select which ETW providers to use. Deselect everything else except the FieldMedic-GPUview profile you just copied to the phone (it should be at the bottom of the list).

After that tap "back" to get to FieldMedic front page and tap "Start logging". Initializing the logging session takes a while, and then you are ready to try out the scenario you want to investigate. Note that with the settings in the GPUview profile FieldMedic gathers a huge amount of data (often 10s of megabytes per second) so keep your tracing session as short as possible. Half a minute is OK and usually sufficient; ten minutes of data will fill your phone's storage and make even a high end PC feel slow when analyzing it.
When you are finished go back to FieldMedic and tap "stop logging".
Analyzing a trace
You can find recorded traces in phone's Documents\FieldMedic\Reports directory. FieldMedic creates a subfolder for every logging session with recording date in its name. Inside the folder there are several files but we are interested only in the file named Custom-FieldMedic-gpuview.etl. Just copy that to your PC and open in GPUview (if you don't have GPUview installed yet, it is part of Windows Performance Toolkit which comes bundled with Windows 10 SDK)
As an example, here is a trace I captured while playing Angry Birds with my Lumia 735:
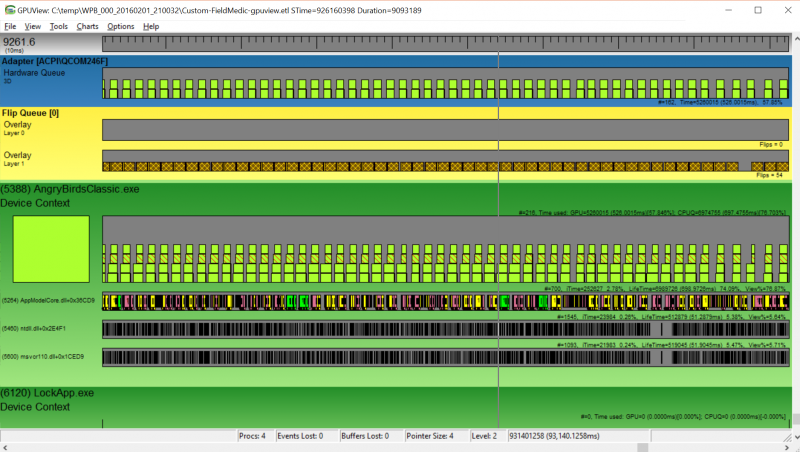
If you are not familiar with GPUview, the top line shows GPU activity (blue area). In this case it is rendering a new frame every 1/60 of second and is active for bit more than 50 % of time. This does not necessarily mean that the game uses half of GPU's capacity; more likely system has lowered GPU clock frequency to save power so that utilization stays at 50-60% level. You can find more information about each GPU work item by clicking the green boxes.
Below GPU activity you see flip queue on yellow background, i.e. frames that are ready to be displayed. Note that there is a single frame drop (hole in the right side of the picture). We would need to dive closer to find reason for this (in this case it seems that CPU is kept at little bit too low frequency, which causes work for a frame to take bit over 16.7 ms, finally missing VSYNC)
Below that there is a section for each process (green area) that shows both its GPU work queue(s) and CPU activity for each thread. As you can see Angry Birds does most of its processing in a single thread, with some additional threads. The CPU timeline is constructed from events recorded from Windows scheduler as well as sampling profiler data, so if we had symbols for the application we could see exactly what it is doing; even without symbols we can guess quite a lot from the individual events and operating system stack frames that can be decoded with some help from Microsoft's public symbol server.
Conclusions
One of the best things in GPUview and other tools in Windows Performance Toolkit (WPT) is that you do not need application source code or any other development environment to use them. You can record a trace on any device, or even ask your customer to record it and send to you for analysis. Thanks to FieldMedic this is now possible in phones as well.
This particular example is not very interesting as the game is so simple from rendering point of view and runs smoothly (well, with the one glitch in right side of picture) Next time we'll have a look at some more complex and problematic cases. Meanwhile, this article is a good starting place for learning GPUview.
The recorded ETL file can be opened also with other tools like WPA, which is the general purpose performance analysis tool in WPT. In fact, I have included some providers that cannot be visualized in GPUview but only in WPA, including CPU frequency and power saving information. Bruce Dawson's excellent blog on Windows performance analysis is a good place to start learning about WPA.