Understanding Azure Virtual Machine IOPS, throughput and disk latency – Part 1
I'm regularly asked:
- How best to configure disks in Azure virtual machines for optimal performance.
- Why a deployed a solution may not be performing at the desired level.
When the discussion takes place, we can find:
- There is not a solid understanding of how Azure disks work and perform.
- The requirements and characteristics of the application running on the VM is not well known.
This walkthough covers how to demonstrate and experiment with the following aspects of VM disk performance in Azure.
- IOPS
- Latency
- Throughput
- Standard vs Premium storage
- Local temporary storage
Note : The data and results here are empirical and for the purposes of explaining Azure disk performance. Real world workloads are more complex and seldom fit the simple IO profile used here, so your mileage may vary.
Step 1 - Preparation
In preparation for this demo, deploy a Windows Server 2012 R2 machine in Azure with the following minimum requirements:
- Capable of both standard and premium disks (Currently DS and GS series machines)
- Capable of a minimum of 4 data disks
- Capable of a minimum of 5000 or more IOPS.
In practice, this means a DS2 or higher machine. When deploying a VM in Azure, the portal shows the base capabilities of each machine size:
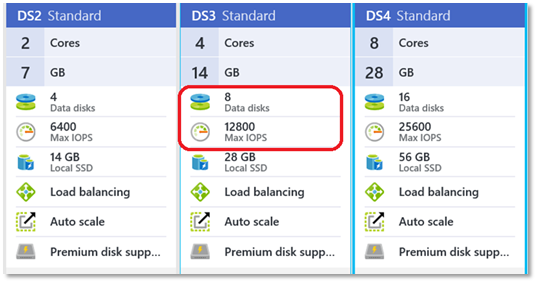
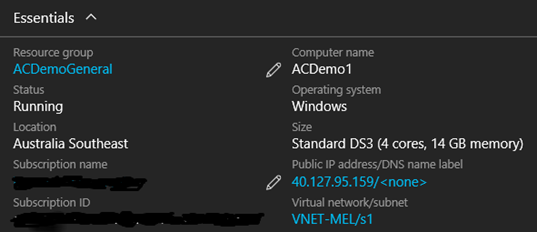
For this test, I am using a DS3 machine, deployed in Australia East:
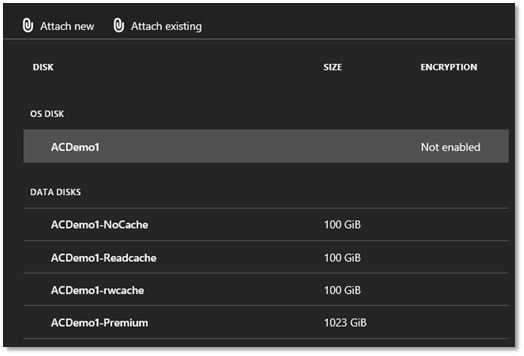
Add 4 additional data disks to the machine (in addition to the base operating system disk)
These disks should be:
| Number/Name | Standard/Premium | Cache Setting | Size |
| Disk 1 | Standard | No cache | 100GB |
| Disk 2 | Standard | Read Cache | 100GB |
| Disk 3 | Standard | Read Write Cache | 100GB |
| Disk 4 | Premium | No cache | P30 (1TB) |
When finished, the disk configuration should look like this:
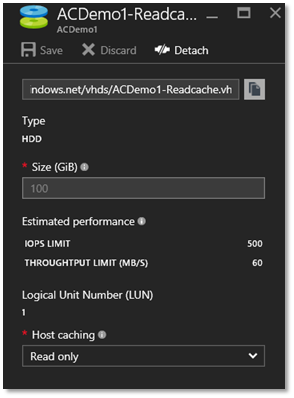
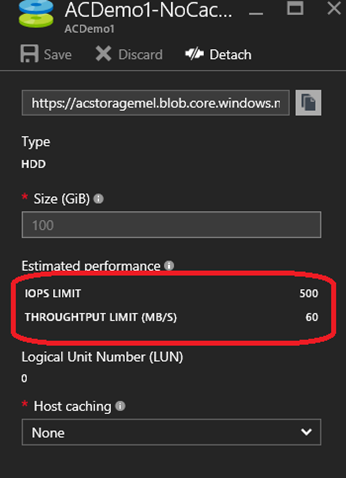
Cache settings can be set on a per disk basis as shown :
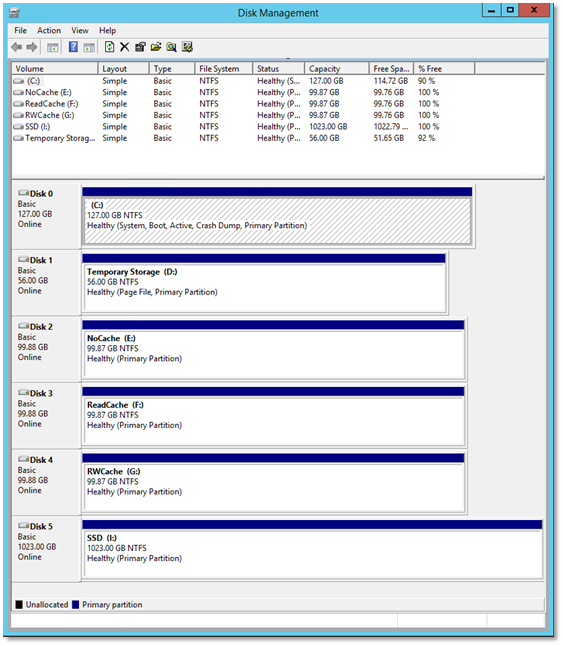
Once the disks have been added to the VM, remote in and start Disk Management.
Each of the disks should be initialised, formatted and assigned a drive letter as shown.
Note: This could also be done using Storage Spaces, but as the goal here is to show individual disk performance rather than aggregate, it is simpler with Disk Management.
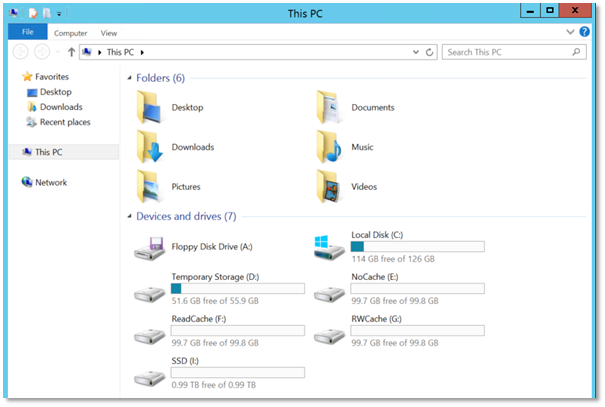
Once correctly configured, explorer should look similar to this:
Step 2 - Testing Tools
For this test, Iometer was used to generate the load and display the results.
Iometer can be found here : https://iometer.org/
Other testing tools would be expected to generate the same results given the same inputs.
Expected Results
As shown in the images below:
- A standard disk is expected to handle 500 IOPS or 60MB/s
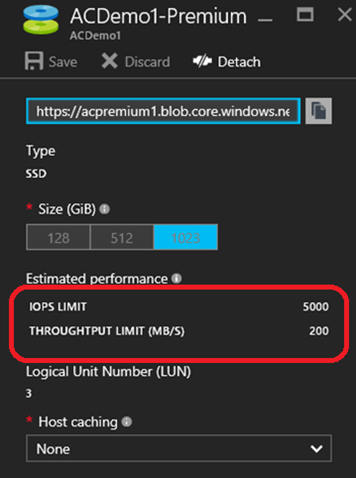
- A P30 Premium disk is expected to handle 5000 IOPS or 200MB/s
However, be aware:
- Any disk will be limited at the lower of IOPS or throughput limits
- The ability for an application can achieve these numbers is also dependant on the manner in which reads/writes are performed. Applications which perform 'single threaded' IO will often hit a latency bottleneck before they hit these other limits.
Test 1: IOPS on a Standard Disk
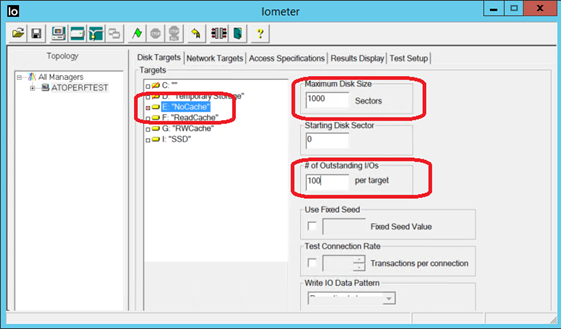
Start Iometer and select the following values:
- Disk Target : E: Drive (no cache)
- Maximum Disk Sectors : 1000
- # outstanding IOs : 100
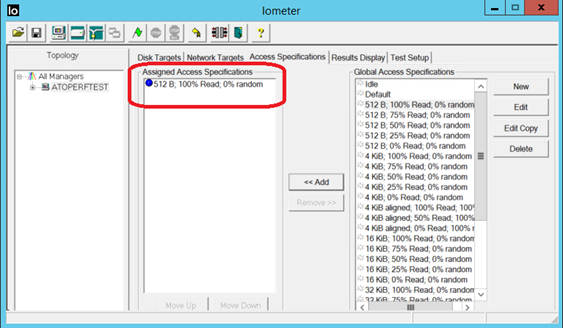
- Access Specification : 512 B 100% Read
Start the test:
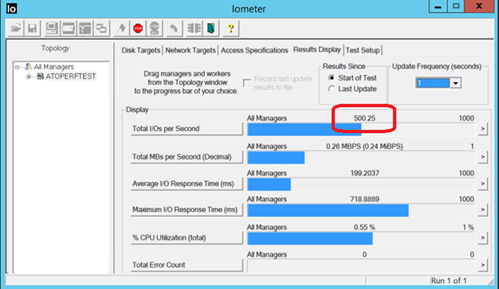
Observations
- The results should show a consistent 500 IOPS (Change the update frequency to 1 second in Iometer)
- Throughput is low – because block size is low (500 IOPS * 512 Bytes = 0.26MB/s)
- Average Latency is high – mainly because concurrent outstanding IO's is also high.
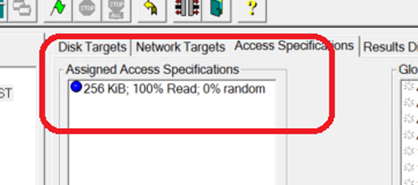
Test 2 – Throughput on a single disk
Change the access specification from 512 B to 256 KiB 100% Read:
Results:
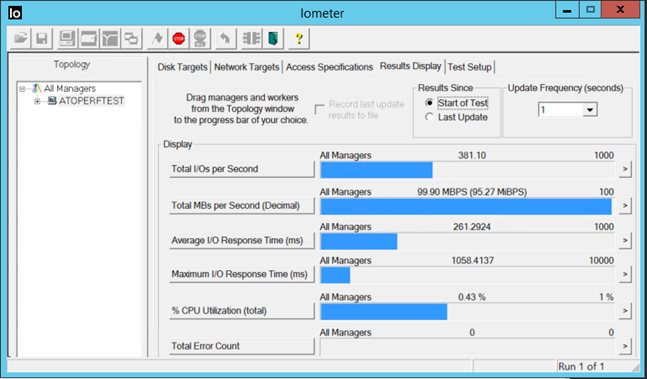
Observations:
- Disk throughput should be much higher.
- While we commit to 60MB/s, I typically see 100MB/s as shown above.
- IOPS is significantly lower as the larger block size means the throughput limit is hit before the IOPS limit (381 IOPS * 256KB = 100MB/s)
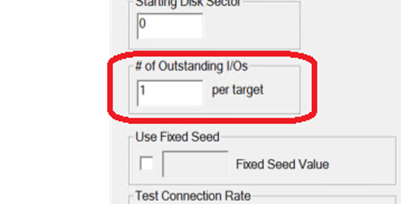
Test 3 – Latency – single standard disk:
Change the outstanding IOs to 1 and re-run the tests :
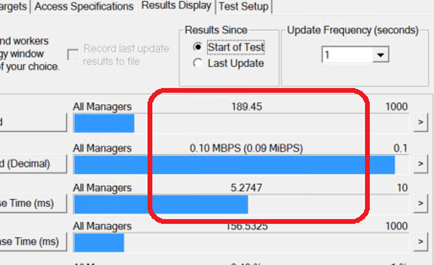
Observations:
- The latency when writing to a standard disk is around 5 ms.
- The IOPS and throughput are both significantly lower than the maximum capabilities of the disk.
What is happening?
- When outstanding IOs is set to 1, Iometer does a read request, waits for the data to come back, and then issues the next request.
- In this scenario, it is simulating an older style application that is performing single threaded IOs
- If each read request takes 5 ms, then a maximum of 200 read requests will be achieved each second.
- (5.27 ms * 189.45 IOPS = 999ms)
Summary:
- Any application that does single threaded IO is likely to suffer reduced IO performance because of latency.
- Caching, local temp storage and/or Premium storage can be used to assist here – see Part 2