Adding Guest Diagnostic Extension to an Existing VM Scale Set
There are some options to create a Virtual Machine Scale Set with the diagnostics extension to perform in-guest monitoring and collect metrics from inside your virtual machines.
On the other hand, if you have an existing Virtual Machine Scale Set without such extension there’s a way to enable them. This is what I’ll show in this post in a detailed way explaining how to configure each one of the parameters required.
How do I know if I have diagnostics extension deployed or not?
The first thing to notice if you are looking to monitor your guest VMs in a VM Scale Set is if you already have the extension deployed or not. This is easy to be accomplished by going to the VMSS page in the Azure Portal and clicking on Metrics. If there are no metrics available in the Guest section this means there’s no diagnostic extension installed and only metrics provided at the Host level, captured by the virtualization layer are available. The picture bellow shows this scenario:
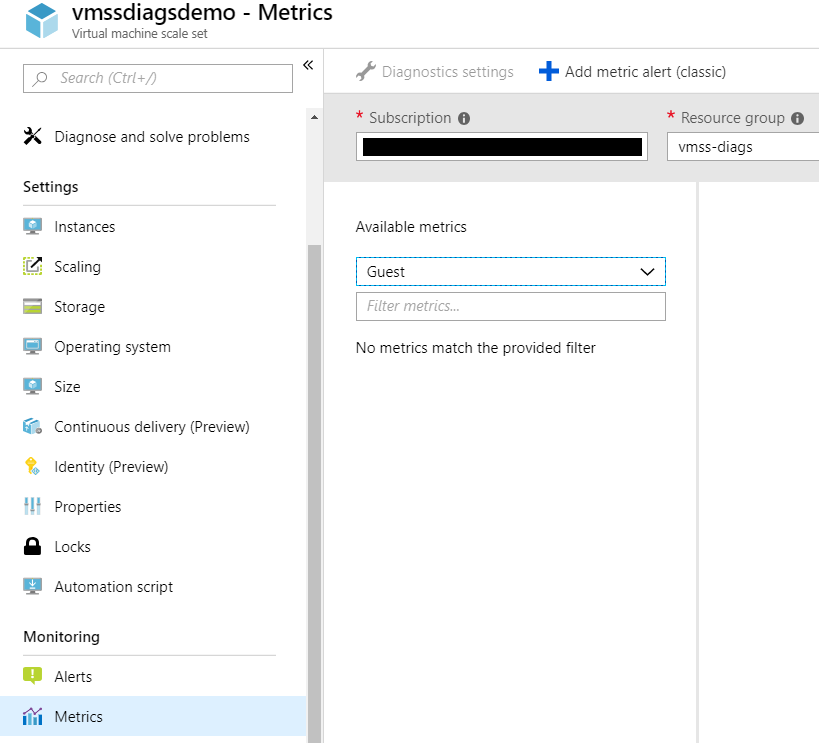
So, as there’s no Guest metrics available, we can conclude that the extension is not installed and we can install it.
Storage Account
To hold diagnostics data we need a storage account provisioned, you can provision a new storage account or use an existing one.
Getting the Default Config
The first step to work with Azure VM Scale Set diagnostics is to get the default config. This is a template file we use to enable the diagnostics extension and also we can customize it to fit our needs.
You can run the following command to get the VMSS diagnostic config file and send it to a file named config.json:
az vmss diagnostics get-default-config > config.json
You will notice that a config.json file will be generated in the current folder while another JSON will be output to the screen. Copy this JSON as it will be the one you will use to put protected data like the Storage Account SAS Token and place it in a file called protected-settings.json. We will use both files.
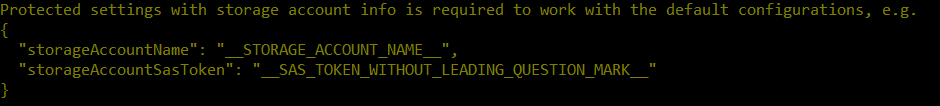
Fill the protected-settings.json with the storage account information. In the storageAccountName field, enter the name of the storage account you provisioned to hold diagnostics data and in the storageAccountSasToke enter a SAS token you can generate in the storage account in the Shared access signature section. Just make sure you don’t include the question mark. Also make sure you select a large time frame for the token or you will have to update it later as by default it is valid for just a few hours.
The resulting config will look like the following:

Go back to the config.json file. There you should also enter the name of the storage account in the StorageAccount field and you should also enter the resource ID of the VM Scale Set into the resourceId field. You can get this resource ID in the Azure Portal clicking the VM Scale Set, then Properties, copy the resource ID and paste it into this field. It should be in the format /subscriptions/<subscription id>/resourceGroups/...
Apply the setting
Apply the setting with the following command:
az vmss diagnostics set --resource-group vmss-diags-demo --vmss-name vmssdiagdemo --settings config.txt --protected-settings protected-settings.json
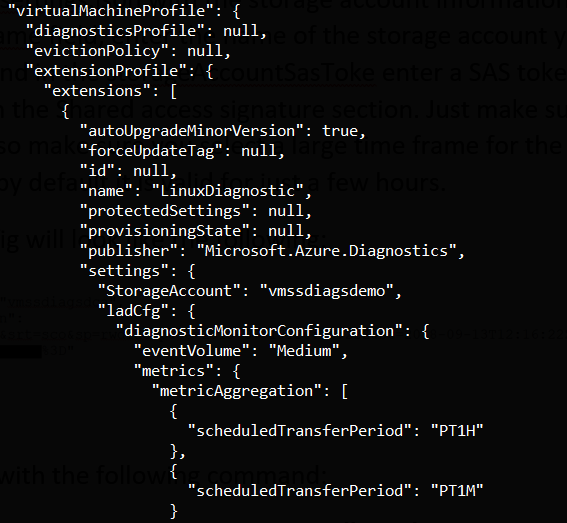
After the application, inspect that the extension is now added to the VMSS as shown in the picture bellow:
Verify the setting
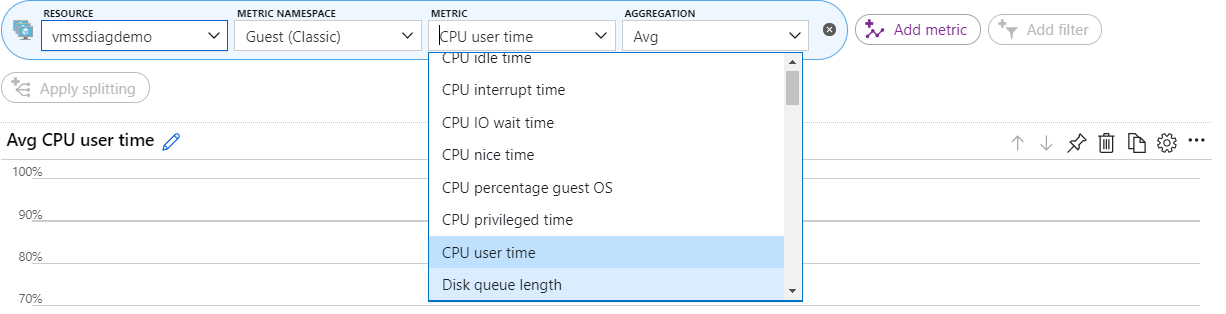
After applying the setting, we can verify it by going back to the Azure Portal and when we go to the Metrics section, we can see that the Guest namespace is now available and the Guest metrics are all available as well.
Summary
This concludes this post, I hope it’s useful for you to enable Guest diagnostics to your virtual machine scale set VMs and make use of it be for monitoring or alerting.